Hey Lance,
Here's that chart. Can you see the difference?
Please bear in mind that I'm not saying LYC's gonna fall from here. It's just to illustrate the difference between the three bars and their backgrounds...on any chart. Just happened that LYC was the example...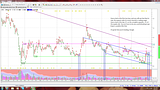
once more unto the breach, page-14


Add LYC (ASX) to my watchlist
 (20min delay) (20min delay)
|
|||||
|
Last
$6.06 |
Change
0.140(2.36%) |
Mkt cap ! $5.664B | |||
| Open | High | Low | Value | Volume |
| $6.02 | $6.12 | $5.97 | $11.52M | 1.904M |
Buyers (Bids)
| No. | Vol. | Price($) |
|---|---|---|
| 3 | 12791 | $6.04 |
Sellers (Offers)
| Price($) | Vol. | No. |
|---|---|---|
| $6.07 | 13019 | 2 |
View Market Depth
| Last trade - 16.10pm 09/08/2024 (20 minute delay) ? |
| LYC (ASX) Chart |