Hi Savtin
You make some excellent points although I would disagree that MGX's performance in the last 1-2 weeks is disappointing. I'll give you my (amateur) analysis:
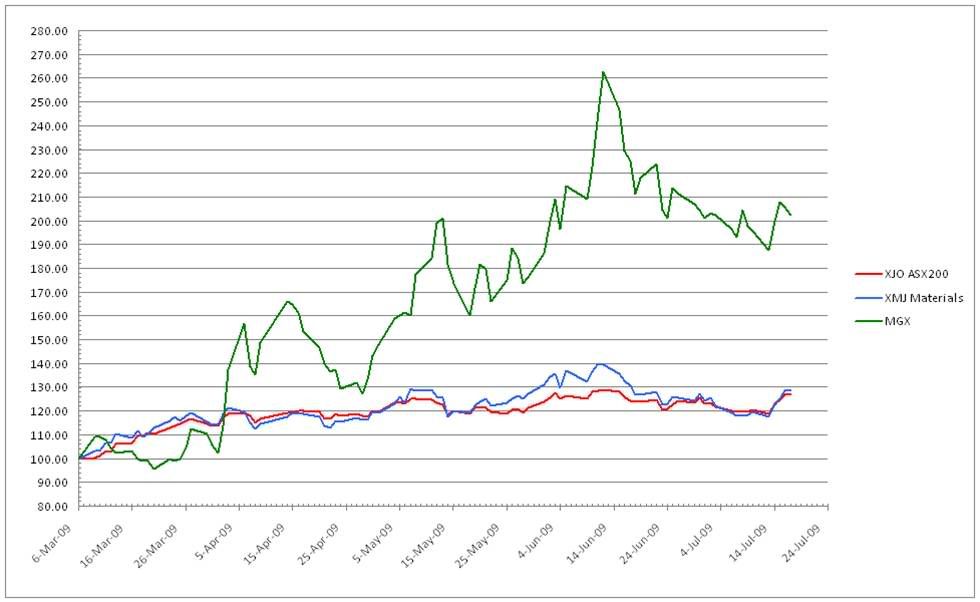
If you compare MGX's performance against the market (i.e. ASX200) and the mining sector (XMJ) since the start of the rally in March, then MGX has easily outperformed both. The following chart shows MGX vs XJO & XMJ, where I have taken the level of each at March 6th as a base of 100, and the prices of each since are referenced to the March 6th base level. MGX has still outperformed both indices by a factor of 2:1 since early March, and peaked at a ratio 2.6:1 in June.
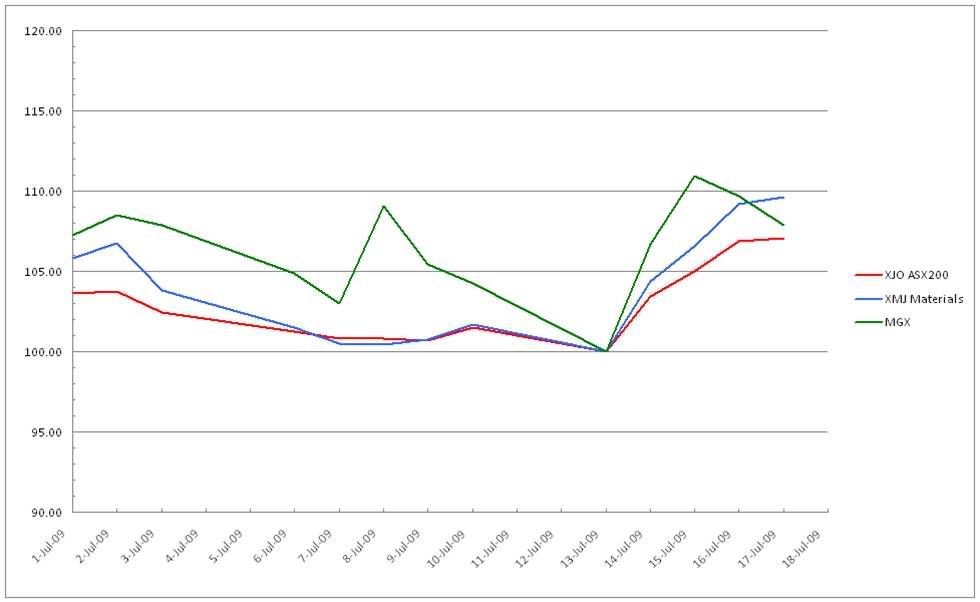
Similarly, you can compare MGX vs XJO & XMJ in July only, using the July 13th low as the reference base level of 100 for each, as shown in the next chart. This chart shows that since the market picked up again this week MGX has picked up by about the same amount (about 7%), and in July has performed essentially in line with both indices. It probably seems disappointing besause we've seen MGX surge much high in proportion to the indices since March, but I interpret that as a fair value revaluation of MGX after being recapitalised at the start of the year.
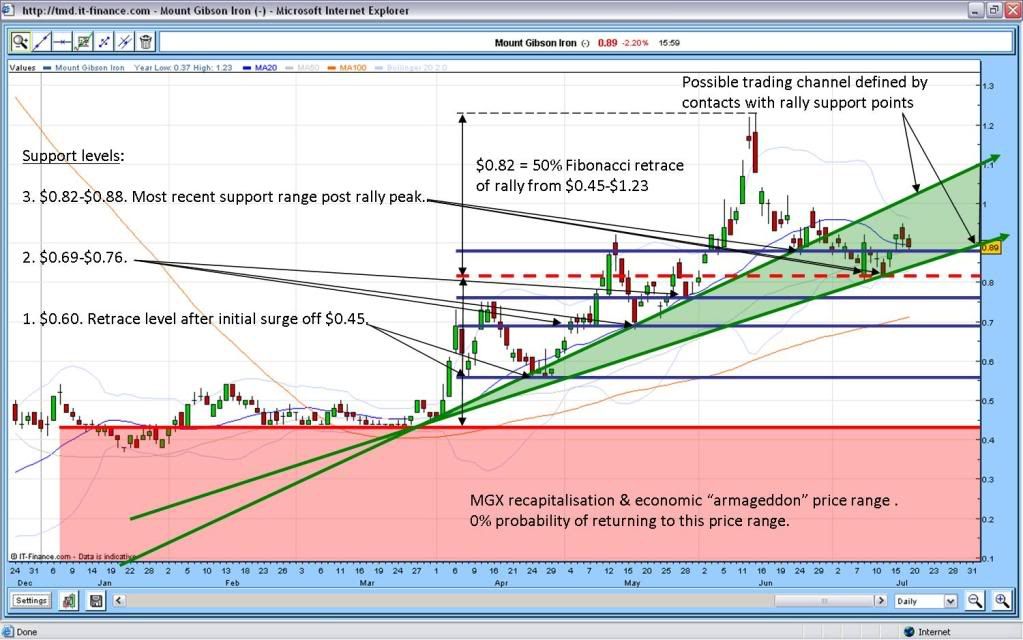
My analysis of the MGX daily candlestick chart (next chart) shows close agreement with your comments in terms of support levels. The $0.80-$0.82 support level by the way is the 50% Fibonacci retrace level of the rally from $0.45-$1.23 - never a coincidence I think. As you said, this is a strong support level accoridng to the daily chart, depending on how the general market performs I think (i.e. depending on the extent of any market correction if any when/if the recovery outlook becomes pessimistic again) - if the market outlook turns sharply south then the next range of $0.69-$0.76 could be tested again. For that level to be tested I think the general market outlook would have to get pretty bad AND the IO sector would have to take a hit, say if the chinese IO consumption rate turns out to be unsustainable.
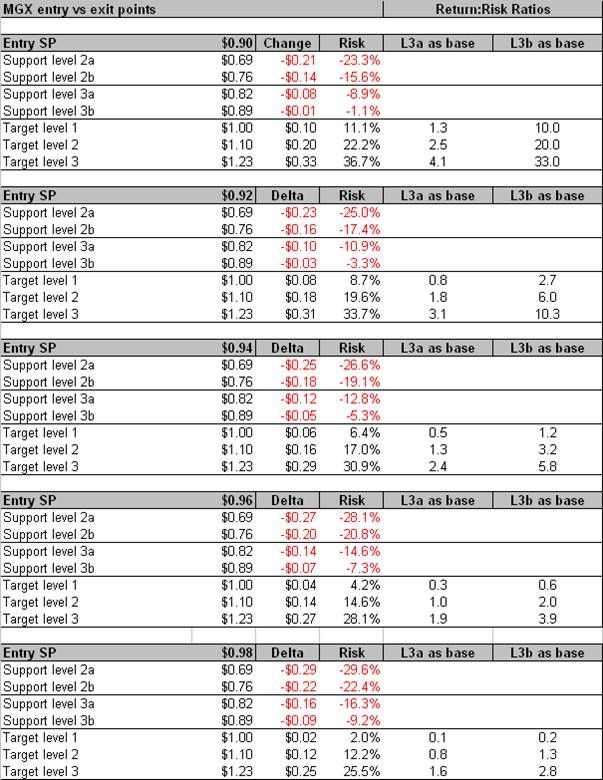
So what does this mean for entry/exit levels? I agree for any trading it'd be wise to set stops just below the $0.80-$0.82 mark. Personally, I have calculated my return vs risk ratios based on entry levels in the $0.90-$1.00 range, in comparison to the support and target levels indicated in the table below. The target levels indicated are only short term - I also hold some long term MGX on my personal expectation we will see $1.50-$2.00 levels in 12+ months.
As the table indicates, entry points in the $0.90-$0.92 show an attractive return:risk ratio, but it currently drops off pretty quick above that (until the higher support level of $0.89 becomes confirmed).
Anyway, I agree, MGX is great LT value at this level, and as far as I'm concerned, pretty attractive to trade in the ST as well given the above as well as regular trading volumes and volatility. Either way, MGX's performance is not disappointing if you put in context of the above and realise that since March its easily outgunned the market and in the last 2 weeks performed in line with the market.
Cheers & good luck. Sharks
- Forums
- ASX - By Stock
- oversold
Hi SavtinYou make some excellent points although I would...
Featured News
Add MGX (ASX) to my watchlist
 (20min delay) (20min delay)
|
|||||
|
Last
33.0¢ |
Change
-0.005(1.49%) |
Mkt cap ! $401.7M | |||
| Open | High | Low | Value | Volume |
| 33.0¢ | 34.0¢ | 33.0¢ | $193.8K | 576.4K |
Buyers (Bids)
| No. | Vol. | Price($) |
|---|---|---|
| 13 | 251983 | 33.0¢ |
Sellers (Offers)
| Price($) | Vol. | No. |
|---|---|---|
| 33.5¢ | 11761 | 2 |
View Market Depth
| No. | Vol. | Price($) |
|---|---|---|
| 13 | 251983 | 0.330 |
| 6 | 278112 | 0.325 |
| 15 | 97424 | 0.320 |
| 5 | 179000 | 0.315 |
| 8 | 478665 | 0.310 |
| Price($) | Vol. | No. |
|---|---|---|
| 0.335 | 11761 | 2 |
| 0.340 | 247216 | 7 |
| 0.345 | 237523 | 8 |
| 0.350 | 189815 | 7 |
| 0.355 | 137345 | 4 |
| Last trade - 16.10pm 15/10/2024 (20 minute delay) ? |
Featured News
| MGX (ASX) Chart |
The Watchlist
JBY
JAMES BAY MINERALS LIMITED
Andrew Dornan, Executive Director
Andrew Dornan
Executive Director
SPONSORED BY The Market Online


