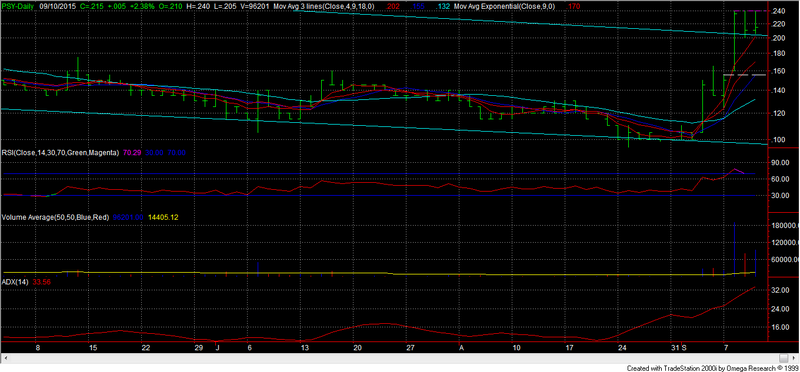
It appears to be a triple top at 24.
Or is a pennant on the form? Depends if the sp consolidates above 20.0/20.5. (the new support area after the recent breakout)
A few overbought indicators atm [rsi, stochastics, rate of change], but the others are ok.
There’s also support around the general vicinity of 17.5 (& 15.5 gap level) IMO.
But a break of 24 would be fine to end the week tomorrow.
Perhaps even if it holds up, so that any retracement is kept to a minimum before the possibility of a new weekly high next week.
All just opinion anyway.
Best regards for tomorrow punters!
PSY Price at posting:
21.5¢ Sentiment: None Disclosure: Not Held