Parabolic U.S. Treasury Yield Curve Warning of Hyper Inflation
Interest-Rates / HyperInflation
Jun 10, 2009 - 09:45 AM
By: Gary_Dorsch
Everything depends upon proper judgment. Of ten people who examine the same chart, or listen to the same speech, each person may well understand it differently - perhaps only one of them will understand it correctly. How then should traders interpret the shape of the US Treasury yield curve, which has gone parabolic in recent weeks, steepening to its highest level since 2004? Similarly, in Australia, the Treasury yield curve is at its steepest in history.
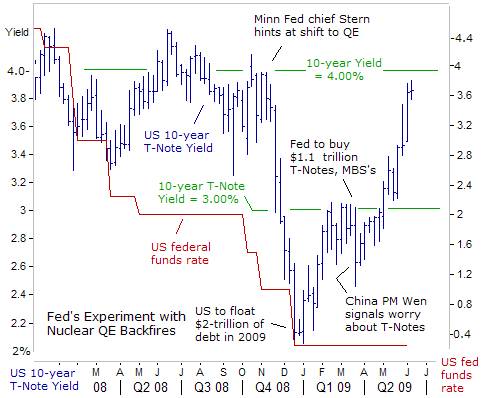
Not surprisingly, Federal Reserve officials were quick to provide a few explanations. “In recent weeks, yields on longer-term Treasury securities and fixed-rate mortgages have risen,” said Fed chief Ben “Bubbles” Bernanke on June 3rd. “These increases reflect concerns about large federal deficits, but also greater optimism about the economic outlook, a reversal of flight-to-quality flows, and technical factors related to the hedging of mortgage holdings,” he explained.
As the massive shockwaves to the financial markets from Lehman Brother’s collapse in September have subsided, and the once frozen corporate bond market has thawed-out, - the panic that caused Treasury-bill rates to briefly fall below zero percent for the first time is a fading memory. Fears of another “Great Depression” of the 1930’s have been replaced with cautious optimism over the arrival of “green-shoots,” or signs that the global economy is stabilizing from its free-fall.
Alongside the swift recovery of the global stock markets, the US Treasury yield curve has gone parabolic, and the Fed’s propaganda artists are wringing their hands of any culpability. “I personally don’t believe the rise in long-term bond yields is due to inflation fears,” said Dallas Fed chief Richard Fisher on June 2nd. Rather, “the yield curve’s steepening appears to reflect an improvement in the economic outlook, combined with the Treasury’s huge borrowing needs,” he said.
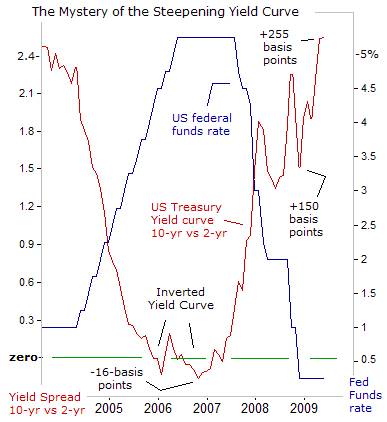
Typically, the Treasury yield curve steepens, when long-term yields are rising faster than shorter-term rates, and the majority of traders are anticipating an economic recovery, to be followed by a tightening of monetary policy. Conversely, the rare appearance of an inverted yield curve, (short-term rates above longer-term yields), has typically materialized near the end of a tightening cycle, and in many cases, telegraphs an economic recession within 12-to-18-months.
The steepening of the US Treasury yield curve is one of the great mysteries in the marketplace today. The US Treasury’s 10-year note is yielding about +254-basis points above the 2-year yield, which is somewhat of an anomaly, since such a wide spread would normally be associated with expectations of a V-shaped recovery for the US-economy. Moreover, the Fed would typically send hints to the markets, that it’s ready to start draining excess liquidity from the money markets, in order to keep inflationary pressures in check.
.......
http://www.marketoracle.co.uk/Article11232.html


Add to My Watchlist
What is My Watchlist?
 (20min delay) (20min delay)
|
|||||
|
Last
26,683 |
Change
82.730(0.31%) |
Mkt cap ! n/a | |||
| Open | High | Low |
| 26,683 | 0.00 | 0.00 |