In this cae, on the weekly, since the surge from the march lows, we have yet to have a touch or pierce of the 21MA. The current situation is a first, suggesting that sustained trend reversal is less likely on the weekly timespan.
But while we are here, Note that the MACD has performed a downside cross over, and note also that the stochasticks are pointing down.
Okay moving on the Daily and the middle tine of the Pitchfork I have had sitting on the chart for a while.
So far Price has respected the top tine rather well, and had two bounces in its meandering journey downwards.
Two hits already? The third is oft the break through... we are approaching this tine/trendline for the third time...
Be that as it may... it is interesting to note that there is some historical resistance as marked by the blue arrow at the left of the chart, and the coincidence with the middle tine should not be ignored, nor the fact as pointed out on the weekly chart above, that this is also the location of the 21 Period Moving average and could provide resistance (bounce point) in that higher timespan.
So lets take a bit of a look at how price is approaching this area from a lower timespan perspective:
Unto the Hourly...Big Picture view
This is over the same timespan as the daily above so we can see on the lefthand side the historical resistance, and also note the previously marked band of support Resistance (two thick Horizontal black lines) has been fairly resoundingly broken. Again after the third time this level was tested.
Okay.. A bit of a zoom in on the hourly:

Here we can see we have definate divergence from the previous marked low.
Coupled with a quick check on the stochastics on this timespan, where they are heading into the overbought region, suggestions are that momentum and cycles on this timespan are leaning more to exhaustion to the downside, and strength to the potential of movement exhaustion dowside, as we approach resistance.
Okay moving down even further, now into the 30 minute for a brief gander
This chart is only showing very recent action.
But again note how we actually have some preety strong localised divergenc right on current price3 action.
(Note I am doing this with live charts so price levels are changing along with time as I post.)
Okay let's go to a far lower level and hit the 10 minute:
Okay MACD moving average Divergence is VERY marked here... and I am strongly considering going long, particularly if we get a bounce up of the stochastic.
Things are prolly a bit too interesting to be posting, but I will take a further look at the five minute and see what that is saying.
5 minute:
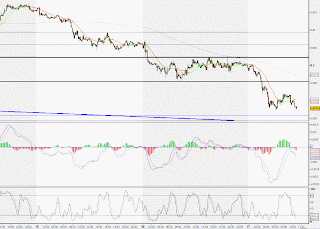
Okay: this is looking pretty hot to trot...
Ive got three arrows on the left hand side pinting at things I would like to see to be happy to get on this right now...
One... a close above the 21MA on price (currently trending down and red
This would also correspond with a breaking of very localised resistance marked by the blue line segment.
Two... A cross over of the Fast blue MACD moving average over the red slow MACD moving average
Three.. the stochastic signal line (thin Black) making it above 50.
Potential price targets hinted by the vertical line on the local extreme negative MACDHistogram, give a range from .892 ish through to .898... support areas recently broken.
Of cours, new lows and the whole hourly down reassesment begins.
Let's see if I can jump on it correctly this time
Trade well all
;)


