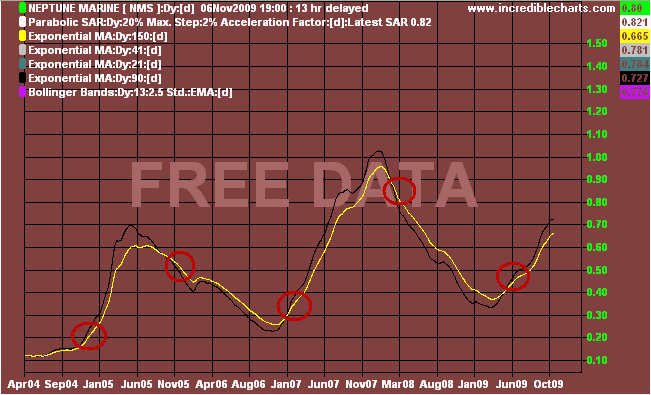
Setup:
Go LONG when 90dma crosses 150dma from below.
Go SHORT when 90dma crosses 150dma from above
Trades in action:
The first circle would have entered us in at ~20c.
The 2nd circle would have exited us at ~50c (150% P)
The 3rd circle would have entered us at ~35c
The 4h circle would have exited us at ~85c (142% P)
The 5th circle would have entered us at ~45c (so far 77% P)
Total profit from system = 369% of capital outlay; but remember, each entry would have had considerably more capital to invest for the new trade than the one prior, so the profit up to now would be far, far greater than those who have simply held from even 20c -> 80c. I would argue the risk would also have been lower. Won't even go into the profit that could have been enjoyed on NMSO if traded in a similar way; but suffice to say i'm sure it would have been 1000%+ of capital outlay.
Now I realise most NMS holders are peculiarly against anything other than fundamental analysis and that's fine. However the point here was 1) to share something I find extremely useful and interesting and 2) to demonstrate that charts and mathematical systems don't have to be highly sophisticated to work effectively and make large profits.
The real beauty of this system has been that you never buy right at the low or sell right at the top, but you get an incredibly large amount of the leg locked-in as profit and eliminate risk by exiting when the trend is down.
Setup: Go LONG when 90dma crosses 150dma from below. Go SHORT...
Add to My Watchlist
What is My Watchlist?


