According to the Intergovernmental Panel on Climate Change (IPCC), "Since systematic scientific assessments began in the 1970s, the influence of human activity on the warming of the climate system has evolved from theory to established fact."1
Scientific information taken from natural sources (such as ice cores, rocks, and tree rings) and from modern equipment (like satellites and instruments) all show the signs of a changing climate.
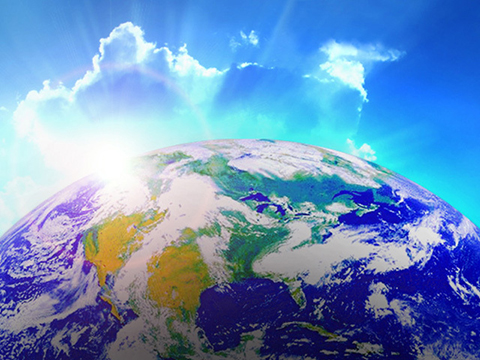
From global temperature rise to melting ice sheets, the evidence of a warming planet abounds.
En español very small variations in Earth’s orbit that change the amount of solar energy our planet
The current warming trend is different because it is clearly the result of human activities since the mid-1800s, and is proceeding at a rate not seen over many recent millennia.1 It is undeniable that human activities have produced the atmospheric gases that have trapped more of the Sun’s energy in the Earth system. This extra energy has warmed the atmosphere, ocean, and land, and widespread and rapid changes in the atmosphere, ocean, cryosphere, and biosphere have occurred.
2 Many of the science instruments NASA uses to study our climate focus on how these gases affect the movement of infrared radiation through the atmosphere. From the measured impacts of increases in these gases, there is no question that increased greenhouse gas levels warm Earth in response.
"Scientific evidence for warming of the climate system is unequivocal."
- Intergovernmental Panel on Climate Change
Ice cores drawn from Greenland, Antarctica, and tropical mountain glaciers show that Earth’s climate responds to changes in greenhouse gas levels. Ancient evidence can also be found in tree rings, ocean sediments, coral reefs, and layers of sedimentary rocks. This ancient, or paleoclimate, evidence reveals that current warming is occurring roughly 10 times faster than the average rate of warming after an ice age. Carbon dioxide from human activities is increasing about 250 times faster than it did from natural sources after the last Ice Age.3
4 Most of the warming occurred in the past 40 years, with the seven most recent years being the warmest. The years 2016 and 2020 are tied for the warmest year on record.5
The Ocean Is Getting Warmer
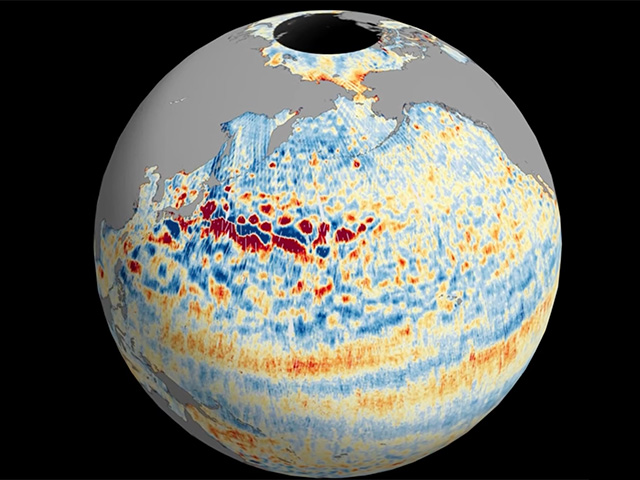
The ocean has absorbed much of this increased heat, with the top 100 meters (about 328 feet) of ocean showing warming of 0.67 degrees Fahrenheit (0.33 degrees Celsius) since 1969.6 Earth stores 90% of the extra energy in the ocean.
The Ice Sheets Are Shrinking
The Greenland and Antarctic ice sheets have decreased in mass. Data from NASA's Gravity Recovery and Climate Experiment show Greenland lost an average of 279 billion tons of ice per year between 1993 and 2019, while Antarctica lost about 148 billion tons of ice per year.7
Glaciers Are Retreating
Glaciers are retreating almost everywhere around the world — including in the Alps, Himalayas, Andes, Rockies, Alaska, and Africa.8
Snow Cover Is Decreasing
Satellite observations reveal that the amount of spring snow cover in the Northern Hemisphere has decreased over the past five decades and the snow is melting earlier. Image credit: NASA/JPL-Caltech9
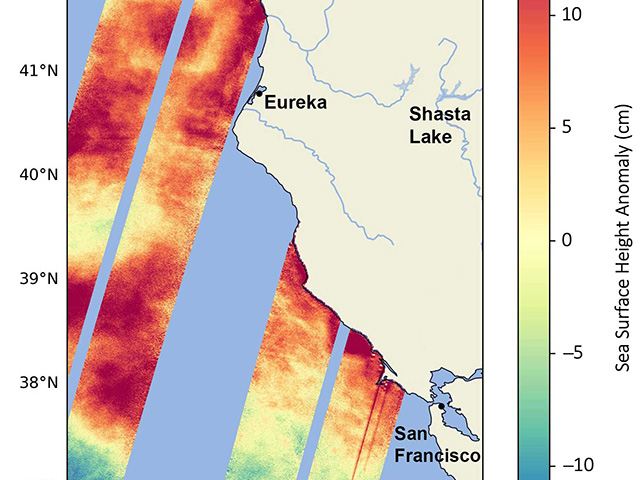
Sea Level Is Rising
Global sea level rose about 8 inches (20 centimeters) in the last century. The rate in the last two decades, however, is nearly double that of the last century and accelerating slightly every year.10
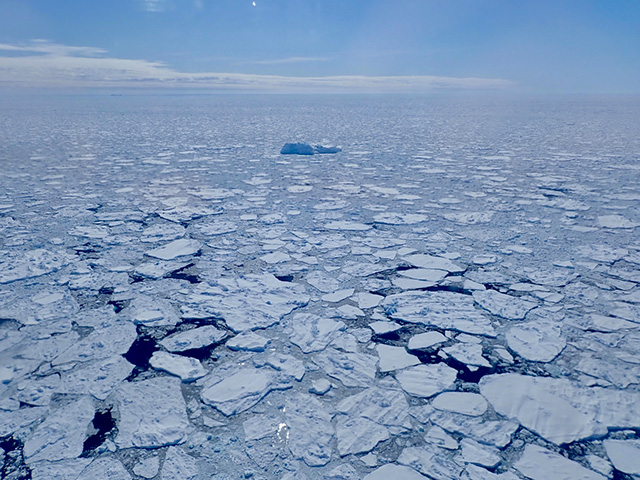
Arctic Sea Ice Is Declining
Both the extent and thickness of Arctic sea ice has declined rapidly over the last several decades.11
Extreme Events Are Increasing in Frequency
The number of record high temperature events in the United States has been increasing, while the number of record low temperature events has been decreasing, since 1950. The U.S. has also witnessed increasing numbers of intense rainfall events.12
Ocean Acidification Is Increasing
Since the beginning of the Industrial Revolution, the acidity of surface ocean waters has increased by about 30%.13,14 This increase is due to humans emitting more carbon dioxide into the atmosphere and hence more being absorbed into the ocean. The ocean has absorbed between 20% and 30% of total anthropogenic carbon dioxide emissions in recent decades (7.2 to 10.8 billion metric tons per year).15,16
Image credit: NOAA
B.D. Santer et.al., “A search for human influences on the thermal structure of the atmosphere.” Nature 382 (04 July 1996): 39-46. https://doi.org/10.1038/382039a0.
**riele C. Hegerl et al., “Detecting Greenhouse-Gas-Induced Climate Change with an Optimal Fingerprint Method.” Journal of Climate 9 (October 1996): 2281-2306. https://doi.org/10.1175/1520-0442(1996)009<2281GGICC>2.0.CO;2.
V. Ramaswamy, et al., “Anthropogenic and Natural Influences in the Evolution of Lower Stratospheric Cooling.” Science 311 (24 February 2006): 1138-1141. https://doi.org/10.1126/science.1122587.
B.D. Santer et al., “Contributions of Anthropogenic and Natural Forcing to Recent Tropopause Height Changes.” Science 301 (25 July 2003): 479-483. https://doi.org/10.1126/science.1084123.
T. Westerhold et al., "An astronomically dated record of Earth’s climate and its predictability over the last 66 million years." Science 369 (11 Sept. 2020): 1383-1387. https://doi.org/10.1126/science.1094123
In 1824, Joseph Fourier calculated that an Earth-sized planet, at our distance from the Sun, ought to be much colder. He suggested something in the atmosphere must be acting like an insulating blanket. In 1856, Eunice Foote discovered that blanket, showing that carbon dioxide and water vapor in Earth's atmosphere trap escaping infrared (heat) radiation.
In the 1860s, physicist JohnTyndall recognized Earth's natural greenhouse effect and suggested that slight changes in the atmospheric composition could bring about climatic variations. In 1896, a seminal paper by Swedish scientist Svante Arrhenius first predicted that changes in atmospheric carbon dioxide levels could substantially alter the surface temperature through the greenhouse effect.
In 1938, Guy Callendar connected carbon dioxide increases in Earth’s atmosphere to global warming. In 1941, Milutin Milankovic linked ice ages to Earth’s orbital characteristics. Gilbert Plass formulated the Carbon Dioxide Theory of Climate Change in 1956.
K. von Schuckmann, L. Cheng, L,. D. Palmer, J. Hansen, C. Tassone, V. Aich, S. Adusumilli, H. Beltrami, H., T. Boyer, F. Cuesta-Valero, D. Desbruyeres, C. Domingues, A. Garcia-Garcia, P. Gentine, J. Gilson, M. Gorfer, L. Haimberger, M. Ishii, M., G. Johnson, R. Killick, B. King, G. Kirchengast, N. Kolodziejczyk, J. Lyman, B. Marzeion, M. Mayer, M. Monier, D. Monselesan, S. Purkey, D. Roemmich, A. Schweiger, S. Seneviratne, A. Shepherd, D. Slater, A. Steiner, F. Straneo, M.L. Timmermans, S. Wijffels. "Heat stored in the Earth system: where does the energy go?" Earth System Science Data 12, Issue 3 (07 September 2020): 2013-2041. https://doi.org/10.5194/essd-12-2013-2020.
I. Velicogna, Yara Mohajerani, A. Geruo, F. Landerer, J. Mouginot, B. Noel, E. Rignot, T. Sutterly, M. van den Broeke, M. Wessem, D. Wiese, "Continuity of Ice Sheet Mass Loss in Greenland and Antarctica From the GRACE and GRACE Follow-On Missions." Geophysical Research Letters 47, Issue 8 (28 April 2020): e2020GL087291. https://doi.org/10.1029/2020GL087291.
D.A. Robinson, D. K. Hall, and T. L. Mote, "MEaSUREs Northern Hemisphere Terrestrial Snow Cover Extent Daily 25km EASE-Grid 2.0, Version 1 (2017). Boulder, Colorado USA. NASA National Snow and Ice Data Center Distributed Active Archive Center. doi: https://doi.org/10.5067/MEASURES/CRYOSPHERE/nsidc-0530.001.
USGCRP, 2017: Climate Science Special Report: Fourth National Climate Assessment, Volume I [Wuebbles, D.J., D.W. Fahey, K.A. Hibbard, D.J. Dokken, B.C. Stewart, and T.K. Maycock (eds.)]. U.S. Global Change Research Program, Washington, DC, USA, 470 pp, https://doi.org/10.7930/j0j964j6.
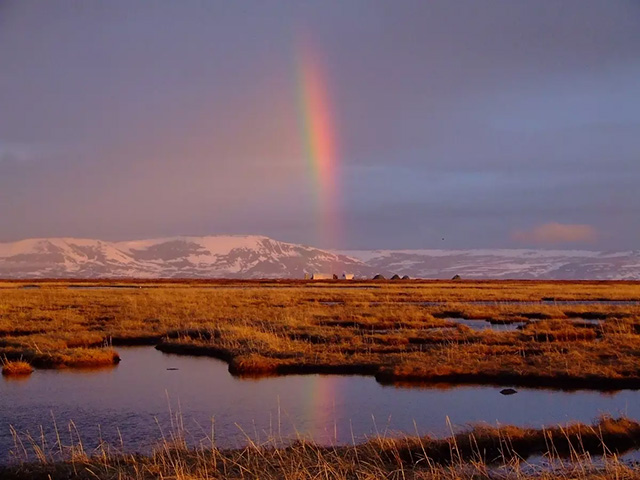
Header image shows clouds imitating mountains as the sun sets after midnight as seen from Denali's backcountry Unit 13 on June 14, 2019. Credit: NPS/Emily Mesner
GGICC>2.0.CO;2.


 (20min delay)