@seagull cast your skills and eyes over this !!!! Long read and watch and listen...
https://stockcharts.com/articles/wy...tion-phase-absorbing-stock-like-a-sponge.html
What are the conditions that need to be in place prior to a long and sustained rally in a stock? That is an important question to ask because it is not a random accident when a stock rises bigger, better and faster compared to most other stocks. When large, informed interests (Composite Operator) determine that the stock of a company will be a substantial holding in their portfolio, a campaign is planned. The purpose is to acquire a large number of shares at a favorable price with the expectation that the company will experience dynamic growth and propel the stock price to a much higher level. The initial phase of the campaign is to absorb the targeted number of shares. Planning is required as it could take many months to accumulate the desired quantity. The goal is to buy these shares quietly without drawing attention to their activities. The C.O. cannot hide their actions forever; eventually they will be discovered by other C.Os. This early large buyer becomes active in the stock during the Selling Climax, or soon thereafter, and has the greatest advantage in accumulating shares quietly. A Selling Climax is accompanied by large quantities of stock for sale. As the Accumulation Phase progresses it gets harder to purchase large numbers of shares and it requires greater trading skill.
During the entire Accumulation Phase there is an overhanging supply of stock for sale. With careful planning and execution the C.O. intends to absorb these shares at the lowest average price possible. As this phase evolves, greater numbers of C.O.s will be competing for fewer and fewer available shares for sale. The paradox is the public becomes ever more pessimistic when prices remain low and listless. Here is a key to the C.O. strategy; keep prices low. As the Accumulation Phase develops this becomes ever harder to do. Mr. Wyckoff was intimately familiar with the C.O.’s methods and knew that their footprints on the charts could not be hidden.
Absorption is the key feature (that a Wyckoffian cares about) of the Accumulation Phase. The C.O. absorbs shares, like a sponge, at a good price/value with the intention of holding the shares for a very long time. The only scenario that would cause the C.O. to sell these absorbed shares would be much higher prices. If the Composite Operator community absorbs, buys, locks up most of the available floating supply of stock, what happens to the price of the stock? Once the stock is in ‘strong hands’, available supply will be low and even a slight increase in demand will cause the stock price to jump. The major uptrend begins. This is when the Wyckoffian gets busy buying shares to ride along with the large, informed interests.
Last week hedge fund research firm Preqin made news with a report that 92% of hedge fund assets are controlled by 11% of the 5,122 hedge funds in operation. A total of 570 hedge fund managers control $2.78 trillion of assets. Can there be any doubt these hedge funds are the best of the best and deploy their equity capital with great skill? They are competing with each other for the preeminent ideas and are collectively allocating a massive capital base in to equities and other asset classes. Also, these C.O. types are competing with other extremely skilled institutional investors (mutual funds, pension plans, ETFs). Remember, not all institutional investors are Composite Operators and not all Composite Operators are institutional investors. Equity capital tends to concentrate where it will work the hardest. Consequently, as reported by Prequin, the most skilled managers (the C.O.) control the majority of the capital.
 (Click to view a live version)
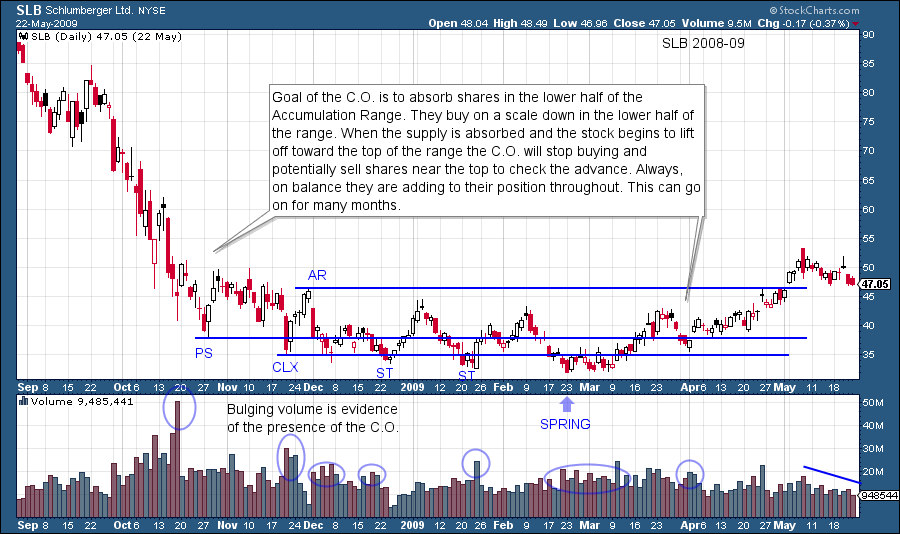
Stock is bought on weakness as the stock price falls from the top of the Accumulation range to the bottom. Support at the bottom of the range is the result of large C.O. buying activity and this can be seen in the spike of volume activity.
 (Click to view a live version)
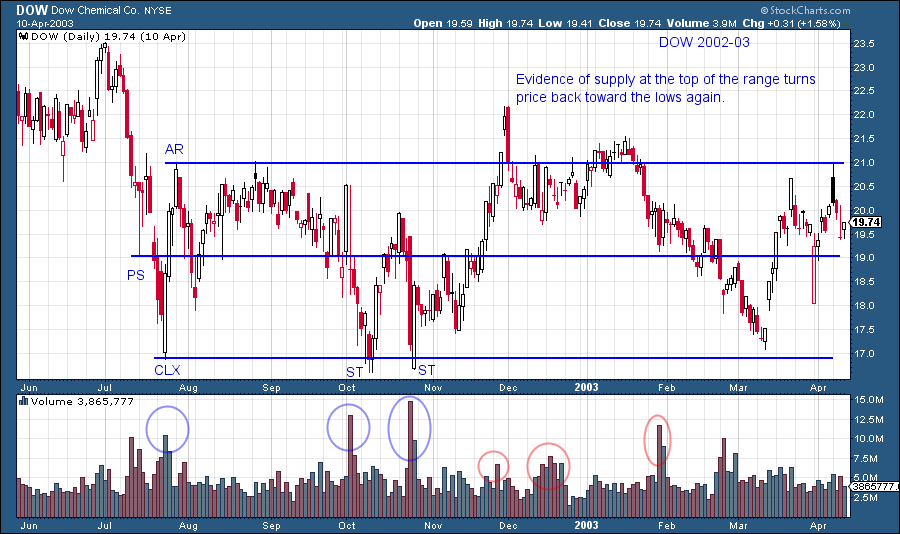
A trading range is a gridlock of supply and demand. In this example DOW has bulges of volume toward the top of the range. Supply is evident and must be absorbed prior to any meaningful uptrend starting. Volume will diminish as the stock progresses further into the Accumulation range. Many stocks have trading ranges that are not actively being absorbed by strong hands. These stocks will not show the attributes of Accumulation and will continue in a trendless pattern for a long time.
 (Click to view a live version)
This week's blog is a discussion of the trendless trading range that follows stopping action (see our prior blog post). For the investor/trader this is an insufferably long time period. Volatility is high and prices are low which leads to capitulation by retail investors as they give up and sell stock. Meanwhile the C.O. is systematically using this environment to buy shares. During all of this back and forth action the Wyckoffian is patiently waiting on the sidelines for that moment when the stock is ready to become active again as the uptrend begins (the subject of upcoming blogs).
 (Click to view a live version)
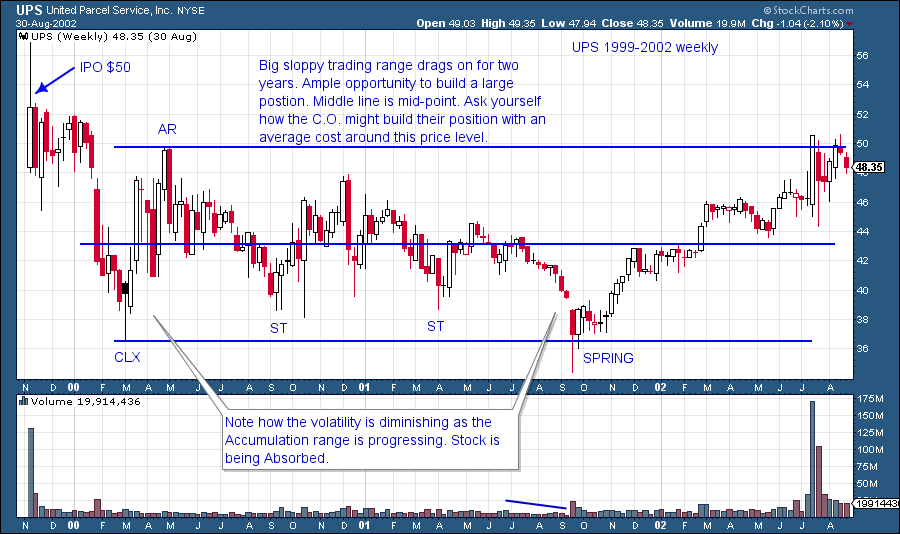
Two years of trading range activity is an excruciatingly long time. Note the final act of this Accumulation is to make a minor new low. This is referred to as a spring. Note the change of character as the price reverses off this Spring action (more on Springs later) and marches up to the top of the range. Compare this rally to the prior rallies in the Accumulation.
Homework: My teaching partner and Wyckoff mentor is the legendary Hank Pruden. Make him your mentor by reading his article "Wyckoff Schematics: Visual Templates for Market Timing Decisions", by Hank Pruden and Max von Lichtenstein. This article and other resources can be found at hankpruden.com. Also checkout Hank's book "The Three Skills of Top Trading". It is a modern day classic.
- Bruce
----------------------------------------------------------
Read the below link....
THE RICHARD WYCKOFF METHOD
http://www.readtheticker.com/Pages/IndLibrary.aspx?65tf=84_richard-wyckoff-method
|
Column 1 |
Column 2 |
Column 3 |
| 0 |
Richard Wyckoff method |
|
|
| 1 |
|
|
|
| 2 |
The originator of this method is from the writings of Richard D Wyckoff. (1873-1934)
|
Column 1 |
| 0 |
 |
|
|
At the age of 15-years old, he became a stock runner, scurrying back and forth on Wall Street. At age 25, he opened his own brokerage office which gave him close contact with several the most important and influential traders Wall Street has ever seen. He studied the market operations of Jay Gould, Jesse Livermore, J.P. Morgan, Andrew Carnegie, along with many others, all in an effort to develop his own approach to the market. These were men who studied the market, understood how and why it moved, and profited from it. Wyckoff methods were successfully applied in a newsletter called 'The Magazine of Wall Street' (known to have 200,000 subscribers in the 1920's). The newsletter became the darling of Wall Street traders.The October 2002 issue of Stocks and Commodities magazine featured an article in which staff writer David Penn went on “a not-so-random walk through the history of charting the markets.” This walk through history led Penn to identify five historical figures as “titans of technical analysis.” He included Charles Henry Dow, Ralph Nelson Elliott, Wim Delbert Gann, Arthur A. Merrill, and Richard D. Wyckoff. About Wyckoff he wrote, “Many of Wyckoff’s basic tenets have become de facto standards of technical analysis: The concepts of accumulation/distribution and the supremacy of price and volume in determining stock price movement are examples.” |
Wyckoff saw the economic principles of supply and demand at work through in disallowed. He believed that the behavior observed through price and volume movements held the key to to forecasting future market movements. These observations led Wyckoff to believe that the market operated under a set of three laws.The Law of Supply and DemandWhen there is an excess amount of something (supply) the value of that item is reduced to draw in the demand needed to absorb that supply. Or, if there is a scarcity of something, then the value of that item will increase to create the supply that will meet that demand.The Law of Cause and EffectIn order for there to be an effect (change in price), there needs to be a cause. The effect will be in direct proportion to that cause. Best price moves occur when there has been enough time to allow for a period of accumulation or distribution (or in other words a cause).The Law of Effort vs ResultsSimply stated, if there is an effort, the result must be in proportion to that effort and cannot be separated from it. If it is not, it is an indication of other principles in action. Think of the effort as the volume on a move, and the result is the corresponding price action. These two should be in harmony. If you have a lot of volume, you should see a lot of move, if you don’t…why? What is happening? This is where we become the detective, use our tools, evaluate that price action (result), with the corresponding volume (effort), and make some deductions based on the “balance of probabilities”.Wyckoff was proof that a great trader was not born or had mystical powers, but resulted from sound training and hard work. He merged the methods of the great traders of the time into a detailed step by step plan. With no confusion or gaps in explanation that is so common is 'How I trade' books, Wyckoff produced charts, trading results, diaries and full explanations. To best understand wyckoffian logic and methods the following texts are a must read (In no particular order).
- Studies in Tape Reading
- Jesse Livermore's Methods of Trading in Stocks
- Charting The Stock Market, The Wyckoff Method
- The Secret Science of Price and Volume
- Master The Markets (book or pdf) and/or The Undeclared Secrets That Drive The Stock Market
- Investing with Volume Analysis
- Wyckoff Schematics: Visual templates for market timing decisions (pdf)
- Trades about to Happen: A Modern adaptation of the Wyckoff Method
- Wyckoff Associates, Inc course book1: Method of Tape Reading
- Wyckoff Associates, Inc course book2: Tape Reading and Active Trading
- Bob Evans (Wyckoff teacher,founder Wyckoff Associates) audio tapes, known as 'Evans Echoes'.
You can find more information on the education page and via our  videos.There is a formal Wyckoff education process from 'Wyckoff Stock Market Institute' .(Note: Readtheticker.com have no association with the institute nor do we have an opinion on their products.)The Wyckoff Way
 Here is a example of Richard Wyckoff Price action road map.
Most important law: Cause and Effect
How did Wyckoff Trade: In short he traded the phase known as 'price mark up/down', which occurs soon after the price had completed a clean break out of a base pattern. Wyckoff would then purchase shares on the dips (assuming the volume conditions warranted price action was still bullish). Wyckoff avoided making trades during significant 'accumulation' and 'distribution' phases within the market.Wyckoff interviewed many famous traders of his time, this is how he learnt to apply the top down stock selection approach: Select the strongest index, select the strongest sectors within the index, select the strongest stocks within the sector (strength was measured on an alpha basis or relative strength). The readtheticker.com Alpha Stock Scanner makes this task a breeze.Wyckoffian logic has found its way into a wide variety of modern day texts, once you read the original source you will clearly uncover adaptations of Richard Wyckoff theories.We acknowledge that Wyckoff implemented nine strict rules for the execution of an investment decision. We at readtheticker.com do not apply his rules with the same discipline, however we acknowledge them and treat them as a guide only.Readtheticker.com annotation tools are excellent for tracking Wyckoffian logic terminology on your favorite stock charts.Click for popup. Clear your browser cache if image is not showing.  Viewing price and volume action on a daily, weekly and monthly charts are the norm. We find favor with viewing price and volume action with Half Month charts (that is start of month to the 15th, then 15th to end of the month), we see these as just right for a wider view of the price action. And yes we can do quarterly as well, just for fun.Click for popup. Clear your browser cache if image is not showing.
  Tom Williams is a master of the Richard Wyckoff method. Tom took the method of reading the bar by bar price action the Wyckoff way to a new exciting level. He called it Volume Spread Analysis (VSA), and it warrants your attention to learn this art. However a word of caution, many are using VSA as the definitive approach to execute trade decisions as if it was the Wyckoff method, they also assume that trading VSA can be applied with success no matter the phase of the market. Our view is that the phase of the market is critical for the Wyckoff method to be successful. As stated above Richard Wyckoff invested when the market entered a mark up or down phase, and we believe this approach should be maintained. VSA can and should be used to formulate a view of price action, but when the Wyckoff investor must execute a trade the market phase, index strength, sector strength and the stock's relative strength are every bit as critical as the VSA view.You can learn more on the subject through Tom Williams books listed on our education page. We are great fans of VSA, our charts are very VSA friendly, plus we allow you to apply VSA multi time frame. The next chart shows you how to apply VSA to both the daily and half month chart at the same time.Click for popup. Clear your browser cache if image is not showing.
  You can also use our Point and Figure charts to complete the Wyckoff accumulation and target exercises.Click for popup. Clear your browser cache if image is not showing.
  In more detail, the Richard Wyckoff price target calculation :Click for popup. Clear your browser cache if image is not showing.
  In Tim Ord's book (The Secret Science of Price and Volume) he explains how to review volume per price swings and when to be bullish or bearish. We added to this the percentage of the float traded each day and swing. The results are always very interesting when you apply Wyckoff logic to float traded as well as volume. (Note: Stock float data is not provided, we use the data from short squeeze.com )Click for popup. Clear your browser cache if image is not showing.
  Richard Wyckoff also uses the indicator called the Optimism Pessimism Index, this is in fact the modern day On Balance Volume indicator which is also available here. We prefer to use our own proprietary RTT_PriceVolume indicator that highlights the divergence in volume relative to price exceedingly well.Richard Wyckoff incorporated the 'Wyckoff Wave' (Our symbol: @RTWWV) within his trading, this is a custom index made up of 12 leading stocks, one for each major market sector. Applying Hurst and Gann together tools only adds further value to the chart.Click for popup. Clear your browser cache if image is not showing.
  Wyckoff Mapping of Chart Action: In the article titled 'Wyckoff Schematics: Visual templates for market timing decisions' (pdf) (see our education page) the authors map out the terminology used within a Wyckoff chart. The mapping of price action in this manner allowed Wyckoff to determine if and when his nine step formula had been achieved. Wyckoff new the process of accumulation (or distribution) was a minefield for the investor as the risk of being stopped out was high and the risk to reward ratio was poor. Wyckoff uses the nine rules to determine when and if the accumulation (or distribution) process was to end and the price mark up (or down) process was about to be begin, the markup (or down) process being the ideal time to take an investment position. Wyckoff wished only to invest in the markup (or down) phase of the stock price cycle, he also new determining the change over from accumulation (or distribution) to mark up (or down) phase was tricky and the risk of loss was at this time highly probable. Wyckoff created the logical approach of the nine rules to be more scientific than artistic or discretionary to limit his risk. Reference: here
The nine rules for buying (long) into the markup process after an accumulation phase
1) Downside Objective Accomplished (PnF)
2) Bullish Price Behavior
3) Preliminary Support and Selling climax (PnF)
4) Stronger than the Market: Harmony/Alpha/Relative Strength
5) Trend line Broken
6) Higher Bottoms: Reason To move.
7) Higher Tops: Reason To move.
8) Base Forming (PnF): The cause.
9) Trade 3:1 Reward / Risk Ratio (PnF): Expected Effect.
The nine rules for selling (short) into the mark down process after a distribution phase
1) Upside Objective Accomplished (PnF)
2) Bearish Price Behavior
3) Preliminary Supply and Buying Climax (PnF)
4) Weaker than the Market: Harmony/Alpha/Relative Strength
5) Trend line Broken
6) Lower Tops: Reason To move.
7) Lower Bottoms: Reason To move.
8) Crown Forming (PnF): The cause.
9) Trade 3:1 Reward / Risk Ratio (PnF): Expected Effect.
The nine steps above are a subset of Wyckoff 5 overall leading steps of evaluation: 1) Determine the present position and probable future trend of the market.2) Select those stocks that are in harmony with the market, in a bull market stronger, in a bear market weaker, using the idea of relative strength.3) Select those stocks that have built a cause for a potential move in keeping with our goals. Use point and figure charts to determine how far the stock is likely to move.4) Determine the stock’s readiness to move and then analyze the standard price and Point and Figure charts with the help of the Nine Buying and Selling Tests.5) Time your commitments with a turn in the general market using the three laws that govern all market behavior.The Wyckoff mapping process is fun and as it puts sign posts on the chart to the direction of Mr Market. You may think that the Wyckoff accumulation and distribution patterns below are just a mirror of the standard technical analysis of double tops, triple tops and head and shoulders, well they do capture those, but they also capture the more complicate patterns. The Wyckoff approach analyzes the inner behavior of the price action to determine if Mr Market is about employ a mark up or down phase. Let's face it, not all patterns break out into tradable trends, they can morph into another pattern. The approach below is the Wyckoff method for filtering out those accumulation and distribution patterns that lack clarity. The only pattern that would not suit this approach is a V reversal pattern as an accumulation or distribution base is not present, this pattern is rare, therefore we would say most of the time the Wyckoff approach is applicable. Here are the headline phases of a stock price.Click for popup. Clear your browser cache if image is not showing. 
Here are the Golden Gate University professors of the Wyckoff course talking about the 'Wyckoff phases'.The Accumulation phase with Wyckoff sign posts. Wyckoff Phases of AccumulationPhase A: In phase A, supply has been dominant and it appears that finally the exhaustion of supply is becoming evident. The approaching exhaustion of supply or selling is evidenced in preliminary support (PS) and the selling climax (SC) where a widening spread often climaxed and where heavy volume or panicky selling by the public is being absorbed by larger professional interests. Once these intense selling pressures have been expressed, and automatic rally (AR) follows the selling climax. A successful secondary test on the downside shows less selling that on the SC and with a narrowing of spread and decreased volume. A successful secondary test (ST) should stop around the same price level as the selling climax. The lows of the SC and the ST and the high of the AR set the boundaries of the trading range (TR). Horizontal lines may be drawn to help focus attention on market behavior.It is possible that phase A will not include a dramatic expansion in spread and volume. However, it is better if it does, because the more dramatic selling will clear out more of the sellers and pave the way for a more pronounced and sustained markup.Where a TR represents a reaccumulation (a TR within a continuing up-move), you will not have evidence of PS, SC, and ST. Instead, phase A will look more like phase A of the basic Wyckoff distribution schematic. Nonetheless, phase A still represents the area where the stopping of the previous trend occurs. Trading range phases B through E generally unfold in the same manner as within an initial base area of accumulation.Phase B: The function of phase B is to build a cause in preparation for the next effect. In phase B, supply and demand are for the most part in equilibrium and there is no decisive trend. Although clues to the future course of the market are usually more mixed and elusive, some useful generalizations can be made.In the early stages of phase B, the price swings tend to be rather wide, and volume is usually greater and more erratic. As the TR unfolds, supply becomes weaker and demand stronger as professionals are absorbing supply. The closer you get to the end or to leaving the TR, the more volume tends to diminish. Support and resistance lines usually contain the price action in phase B and will help define the testing process that is to come in phase C. The penetrations or lack of penetrations of the TR enable us to judge the quantity and quality of supply and demand.Phase C:In phase C, the stock goes through testing. It is during this testing phase that the smart money operators ascertain whether the stock is ready to enter the markup phase. The stock may begin to come out of the TR on the upside with higher tops and bottoms or it may go through a downside spring or shakeout by first breaking previous supports before the upward climb begins. This latter test is preferred by traders because it does a better job of cleaning out the remaining supply of weak holders and creates a false impression as to the direction of the ultimate move.A spring is a price move below the support level of a trading range that quickly reverses and moves back into the range. It is an example of a bear trap because the drop below support appears to signal resumption of the downtrend. In reality, though, the drop marks the end of the downtrend, thus trapping the late sellers, or bears. The extent of supply, or the strength of the sellers, can be judged by the depth of the price move to new lows and the relative level of volume in that penetration.Until this testing process, you cannot be sure the TR is accumulation and hence you must wait to take a position until there is sufficient evidence that markup is about to begin. If we have waited and followed the unfolding TR closely, we have arrived at the point where we can be quite confident of the probable upward move. With supply apparently exhausted and our danger point pinpointed, our likelihood of success is good and our reward/risk ratio favorable.Phase D:If we are correct in our analysis and our timing, what should follow now is the consistent dominance of demand over supply as evidenced by a pattern of advances (SOSs) on widening price spreads and increasing volume, and reactions (LPSs) on smaller spreads and diminishing volumes. If this pattern does not occur, then we are advised not to add to our position but to look to close out our original position and remain on the sidelines until we have more conclusive evidence that the markup is beginning. If the markup of your stock progresses as described to this point, then you’ll have additional opportunities to add to your position.Your aim here must be to initiate a position or add to your position as the stock or commodity is about to leave the TR. At this point, the force of accumulation has built a good potential as measured by the Wyckoff point-and-figure method.In phase D, the markup phase blossoms as professionals begin to move into the stock. It is here that our best opportunities to add to our position exist, just as the stock leaves the TR.Phase E: Depicts the unfolding of the uptrend; the stock or commodity leaves the trading range and demand is in control. Sell offs are usually feeble. The Distribution phase with Wyckoff sign posts.
 Wyckoff Phases of DistributionPhase A: In Phase A, demand has been dominant and the first significant evidence of demand becoming exhausted comes at preliminary supply (PSY) and at the buying climax (BC). It often occurs in wide price spread and at climactic volume. This is usually followed by an automatic reaction (AR) and then a secondary test (ST) of the BC, usually upon diminished volume. This is essentially the inverse of phase A in accumulation.As with accumulation, phase A in distribution price may also end without climactic action; the only evidence of exhaustion of demand is diminishing spread and volume.Where redistribution is concerned (a trading range within a larger continuing down-move), you will see the stopping of a down-move with or without climactic action in phase A. However, in the remainder of the trading range (TR) for redistribution, the guiding principles and analysis within phases B through E will be the same as within a TR of a distribution market top.Phase B: The building of the cause takes place during phase B. The points to be made here about phase B are the same as those made for phase B within accumulation, except clues may begin to surface here of the supply/demand balance moving toward supply instead of demand.Phase C: One of the ways phase C reveals itself after the standoff in phase B is by the sign of weakness (SOW). The SOW is usually accompanied by significantly increased spread and volume to the downside that seem to break the standoff in phase B the SOW may or may not “fall through the ice,” but the subsequent rally back to a “last point of supply” (LPSY), is usually unconvincing for the bullish case and likely to be accompanied by less spread and/or volume.Last point of supply gives you your last opportunity to exit any remaining longs and your first inviting opportunity to exit any remaining longs and your first inviting opportunity to take a short position. An even better place would be on the rally that tests LPSY, because it may give more evidence (diminished spread and volume) and/or a more tightly defined danger point.An upthrust is the opposite of a spring. It is a price move above the resistance level of a trading range that quickly reverses itself and moves back into the trading range. An upthrust is a bull trap — it appears to signal a start of an uptrend but in reality marks the end of the up-move. The magnitude of the upthrust can be determined by the extent of the price move to new highs and the relative level of volume in that movement.Phase C may also reveal itself by a pronounced move upward, breaking through the highs of the trading range. This is shown as an upthrust after distribution (UTAD). Like the terminal shakeout in the accumulation schematic, this gives a false impression of the direction of the market and allows further distribution at high prices to new buyers. It also results in weak holders of short positions surrendering their positions to stronger players just before the down-move begins. Should the move to new high ground be on increasing volume and relative narrowing spread, and price returns to the average level of closes of the TR, this would indicate lack of solid demand and confirm that the breakout to the upside did not indicate a TR of accumulation, but rather a formation of distribution.Successful understanding and analysis of a trading range enables traders to identify special trading opportunities with potentially very favorable reward/risk parameters. When analyzing a trading range, we are first seeking to uncover what the law of supply and demand is revealing to us. However, when individual movements, rallies, or reactions are not revealing with respect to supply and demand, it is important to remember the law of effort versus result. By comparing rallies and reactions within the trading range to each other in terms of price spread, volume, and time, additional clues may be discovered as to the stock’s strength, position, and probable future course.It will also be useful to employ the law of cause and effect. Within the dynamics of a trading range, the force of accumulation or distribution gives us the cause and the potential opportunity for substantial trading profits. The trading range will also give us the ability, with the use of point-and-figure charts, to project the extent of the eventual move out of the trading range and will help us determine if those trading opportunities favorably meet or exceed our reward/risk parameters.Phase D: Phase D arrives and reveals itself after the tests in phase C show us the last gasps or the last hurrah of demand. In phase D, the evidence of supply becoming dominant increases either with a break through the ice or with a further SOW into the trading range after an upthrust.In phase D, you are also given more evidence of the probable direction of the market and the opportunity to take your first or additional short positions. Your best opportunities are at rallies representing LPSYs before a markdown cycle begins. Your legging in of the set of positions taken within phases C and D represents a calculated approach to protect capital and maximize profit. It is important that additional short positions be added or pyramided only if your initial positions are in profit.Phase E: Depicts the unfolding of the downtrend; the stock or commodity leaves the trading range and supply is in control. Rallies are usually feeble. The re accumulation and re distribution phase with Wyckoff sign posts.
 This site has a tool to color zone the each phase (called 'Wyckoff Campaign Phases found in the Analysis chart object tool box).Example
Click for popup. Clear your browser cache if image is not showing. 
Terminology for the abbreviations as supplied by the article 'Wyckoff Schematics: Visual templates for market timing decisions'. More definitive information here
|
Column 1 |
Column 2 |
Column 3 |
Column 4 |
Column 5 |
Column 6 |
Column 7 |
Column 8 |
Column 9 |
Column 10 |
Column 11 |
Column 12 |
Column 13 |
Column 14 |
Column 15 |
Column 16 |
Column 17 |
Column 18 |
Column 19 |
Column 20 |
Column 21 |
Column 22 |
Column 23 |
Column 24 |
Column 25 |
| 0 |
{colgroup} {col=64x@}{/col} {col=306x@}{/col}{/colgroup}AR |
Automatic rally or reactionBC |
Buying ClimaxBOI |
Backing upto iceBTI |
Breaking the iceBUEC |
Backup to edge of creekCREEK |
Critical supportFTI |
First time over iceICE |
Critical resistanceJAC |
Jumping across the creek (or JOC)LPS |
Last point of Support (Demand)LPSY |
Last point of SupplyMD |
Mark downMU |
Mark upPS |
Preliminary support (Demand)PSY |
Preliminary supplySOS |
Sign of strengthSOW |
sign of weaknessST |
Secondary testTSO |
Terminal shake out (Spring)TUT |
Terminal thrustUTAD |
Up thrust after distributionSC |
Selling ClimaxTR |
Trading RangeUT |
Up thrust |
NOTE: readtheticker.com does allow users to load objects and text on charts, however some annotations are by a free third party image tool named Paint.net Investing Quote....."After years of patient study I have proven to my entire satisfaction as well as demonstrated to others that vibration explains every possible phase and condition of the market."..William D Gann.."If past history was all there was to the game, the richest people would be librarians"..Warren Buffett..“It’s not what you own that will send you bust but what you owe.”.. Anon.."Look at market fluctuations as your friend rather than your enemy; profit from folly rather than participate in it"..Warren Buffett..“Because of the extreme challenge, one must commit full attention to it.” Market speculation is “no different than trying to be a successful doctor or lawyer … you simply must devote yourself full-time to the study of your craft”...Bernard Baruch[/table]


