BHP charts galore thread takes too long to load!
Interesting price action on markets generally and more particularly with BHP recently. The SPX & INDU are battling with resistance and displaying long tails on short candlesticks; whereas XJO battling with 4,500.
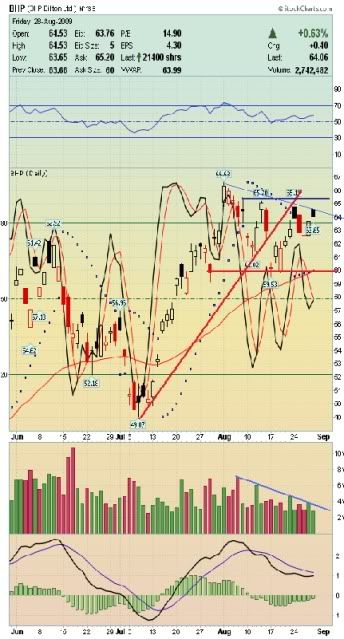
BHP in New York has been losing momentum with indicators bearish crossing and price action making lower lows ~ perhaps support at $60 will soon be tested + don't like those black candles:
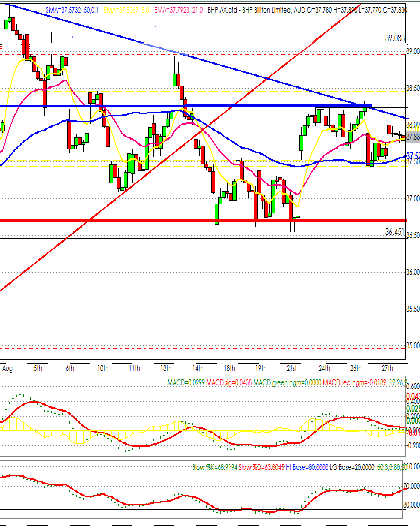
BHP one hour chart shows short term resistance is being respected ~ Perhaps support at $36.60 soon to be tested?
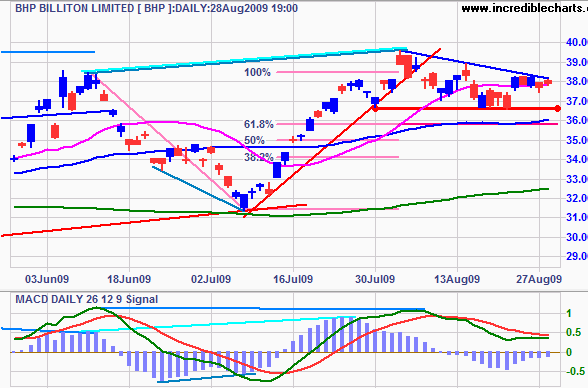
BHP daily chart suggests short term resistance is being respected ~ IMO the indicators suggest support at $36.6 soon to be tested
- Forums
- ASX - By Stock
- BHP
- price channel since nov 08
price channel since nov 08, page-4
Featured News
Add BHP (ASX) to my watchlist
 (20min delay) (20min delay)
|
|||||
|
Last
$40.31 |
Change
-0.050(0.12%) |
Mkt cap ! $204.5B | |||
| Open | High | Low | Value | Volume |
| $40.46 | $40.70 | $40.16 | $280.3M | 6.927M |
Buyers (Bids)
| No. | Vol. | Price($) |
|---|---|---|
| 1 | 12907 | $40.31 |
Sellers (Offers)
| Price($) | Vol. | No. |
|---|---|---|
| $40.35 | 2000 | 1 |
View Market Depth
| No. | Vol. | Price($) |
|---|---|---|
| 1 | 12907 | 40.310 |
| 17 | 31410 | 40.300 |
| 5 | 17308 | 40.290 |
| 2 | 15444 | 40.280 |
| 2 | 29935 | 40.270 |
| Price($) | Vol. | No. |
|---|---|---|
| 40.350 | 2000 | 1 |
| 40.390 | 124545 | 1 |
| 40.490 | 300 | 1 |
| 40.500 | 500 | 1 |
| 40.550 | 7141 | 2 |
| Last trade - 16.10pm 19/11/2024 (20 minute delay) ? |
Featured News
| BHP (ASX) Chart |


