For all those following, I've done a little work in tracking the...

  1. 533 Posts.
    lightbulb Created with Sketch. 17


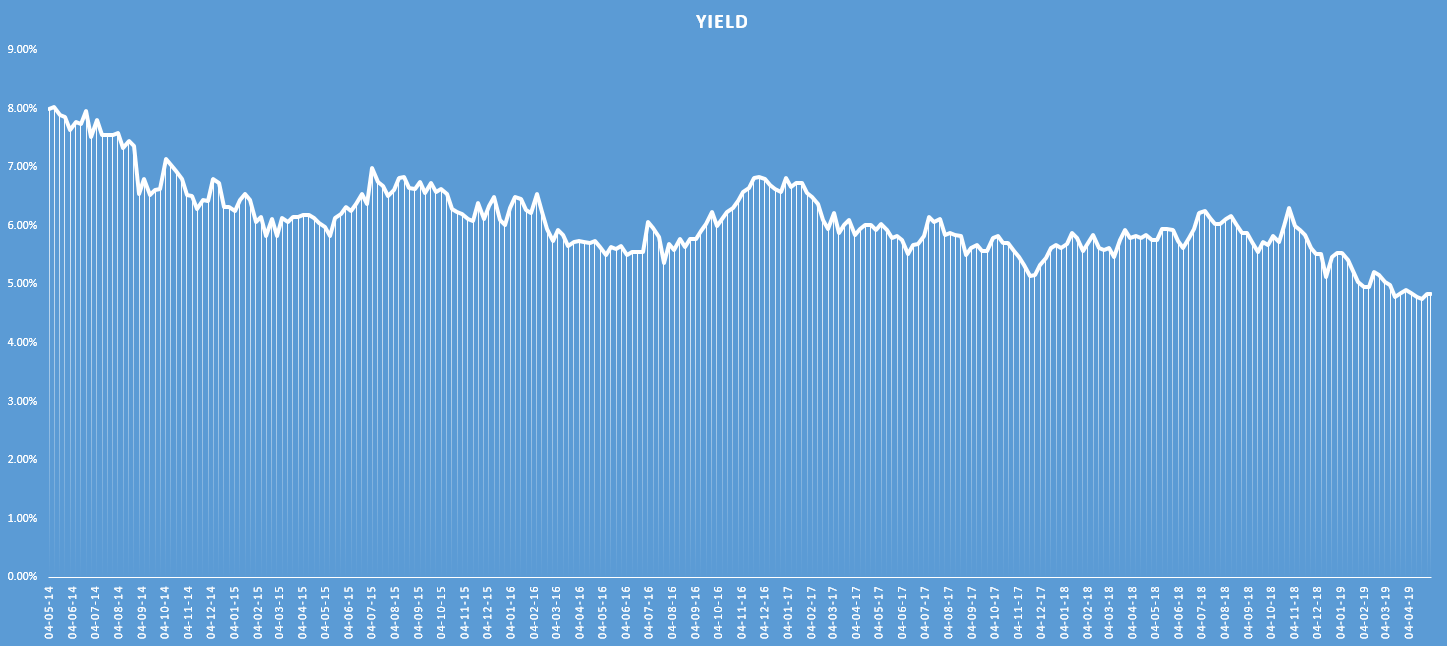
    For all those following, I've done a little work in tracking the yield over time. So this is the yield week by week for ARF since 2014. As you can see it is at an all time low which indicates that the price could be too high. The average yield over time is 6.09% which would give a price today of $1.80.
    I don't think it will reach that but it may come down significantly, which gives a buying opportunity.
 
Add to My Watchlist
What is My Watchlist?
A personalised tool to help users track selected stocks. Delivering real-time notifications on price updates, announcements, and performance stats on each to help make informed investment decisions.
(20min delay)
Last
$3.65
Change
0.050(1.39%)
Mkt cap ! $1.460B
Open High Low Value Volume
$3.61 $3.68 $3.59 $1.782M 488.4K

Buyers (Bids)

No. Vol. Price($)
1 5 $3.63
 

Sellers (Offers)

Price($) Vol. No.
$3.66 2347 1
View Market Depth
Last trade - 16.10pm 30/07/2025 (20 minute delay) ?
ARF (ASX) Chart
arrow-down-2 Created with Sketch. arrow-down-2 Created with Sketch.