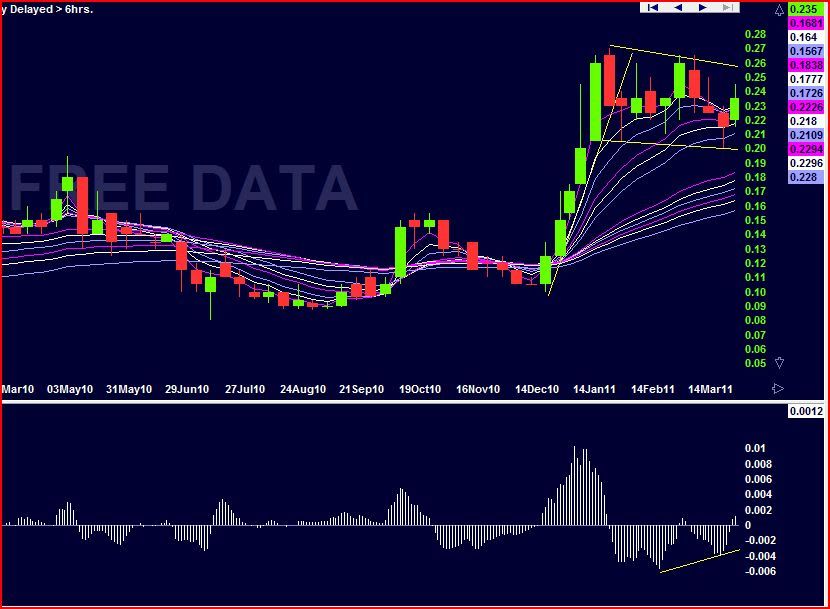
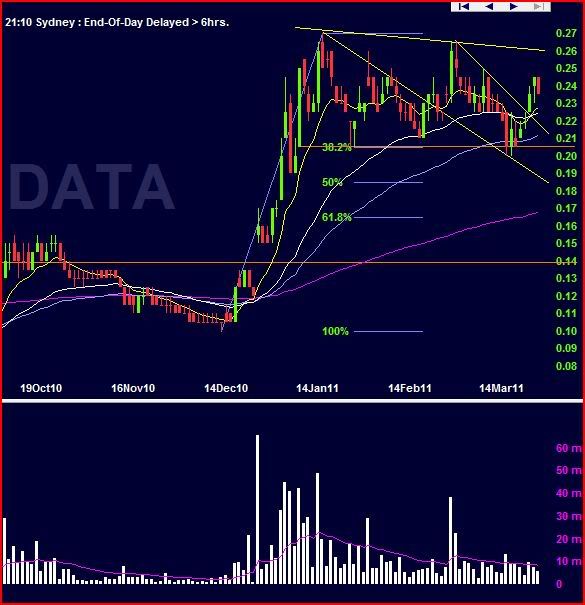
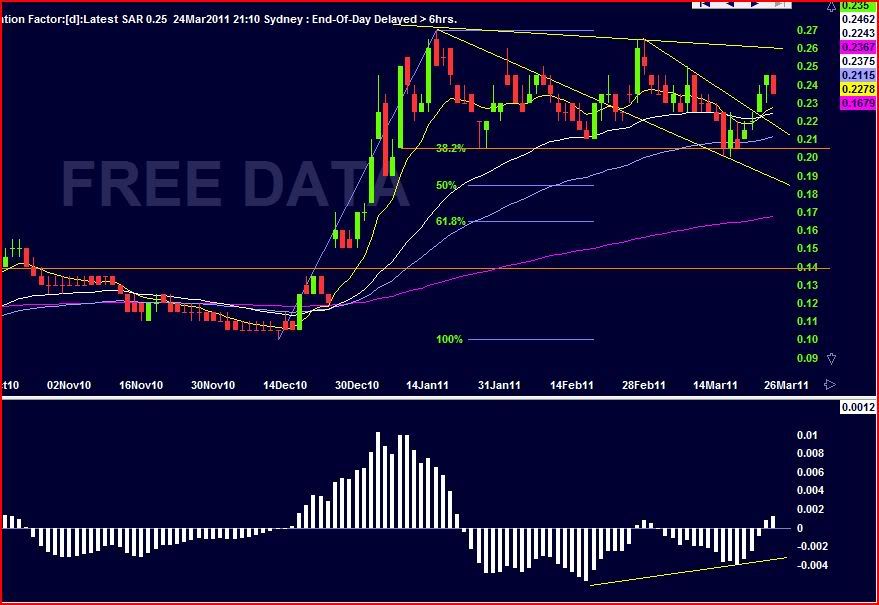
Below is a daily and weekly chart, nice divergence on the macdh. the 38.2% fib has been massive support at this level as well. looks a bit like a bull flag. Last dip bounced off the 63 ema as well. buying in this area to me is a low risk trade or long term entry.
I'm guessing that this pattern has formed due to the buying of shares for the nasdaq listing (both private and bank of NY melon and nsc). Only time will tell.
Vol average over the last sixty days is 10 mill, so if nasdaq was to list 1 mill shares it would have to buy up 30 mill, thats half of the vol for the last 60 days??
Surely nasdaq listing would have more then a mill. Old george soros would buy that all up in one hit. Perhaps 5 mill will do, thats = to 150 mill asx prr. If this is closer to the mark then we have sometime to wait yet.
Good luck all, dyor, the above is only speculation.


- Forums
- ASX - By Stock
- prr charts 24/3/11
Below is a daily and weekly chart, nice divergence on the macdh....
-
-
- There are more pages in this discussion • 4 more messages in this thread...
You’re viewing a single post only. To view the entire thread just sign in or Join Now (FREE)
Featured News
Add IMM (ASX) to my watchlist
 (20min delay) (20min delay)
|
|||||
|
Last
35.5¢ |
Change
0.060(20.3%) |
Mkt cap ! $515.6M | |||
| Open | High | Low | Value | Volume |
| 36.0¢ | 37.5¢ | 33.5¢ | $6.427M | 18.03M |
Buyers (Bids)
| No. | Vol. | Price($) |
|---|---|---|
| 1 | 50000 | 35.5¢ |
Sellers (Offers)
| Price($) | Vol. | No. |
|---|---|---|
| 36.0¢ | 133736 | 5 |
View Market Depth
| No. | Vol. | Price($) |
|---|---|---|
| 1 | 50000 | 0.355 |
| 2 | 9500 | 0.350 |
| 7 | 319326 | 0.345 |
| 13 | 275346 | 0.340 |
| 3 | 64311 | 0.335 |
| Price($) | Vol. | No. |
|---|---|---|
| 0.360 | 133736 | 5 |
| 0.365 | 158076 | 7 |
| 0.370 | 228871 | 10 |
| 0.375 | 209760 | 5 |
| 0.380 | 220968 | 12 |
| Last trade - 16.10pm 12/07/2024 (20 minute delay) ? |
Featured News
| IMM (ASX) Chart |


