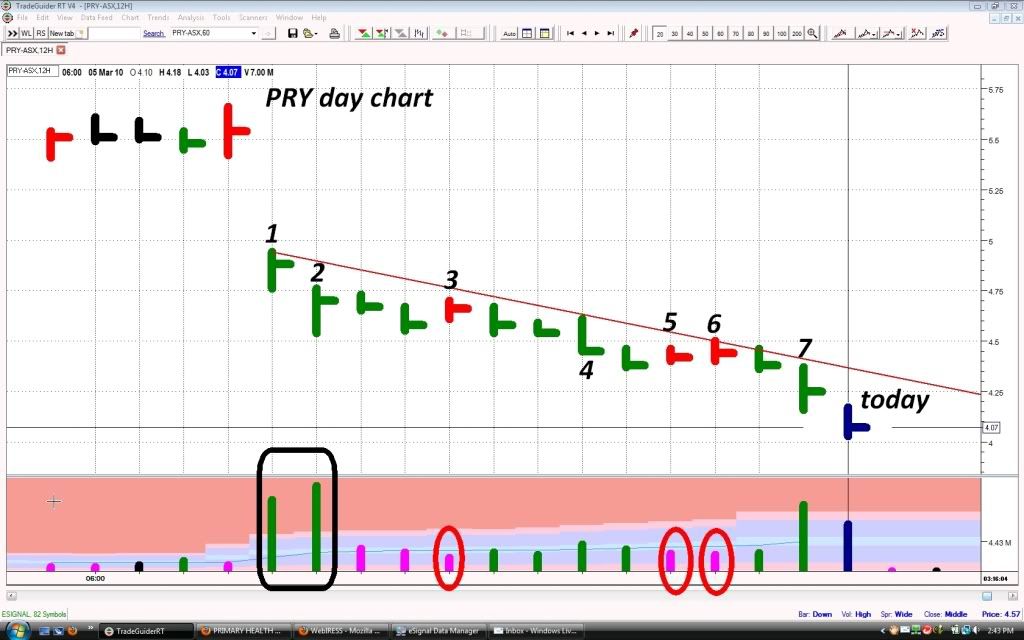
Hi all, this is my take on PRY's chart.
No. 1 & 2. This is obviously on bad news and are very large volume down days, they appeared to have contained some buying because the of the close of the day was high. These buyers ( which contained me ) thought that it would rebound and the bulls would overcome the selling. Not the case
No. 3. This is a weak day indicating a lack of desire to take the price up - evident by the low volume on the day finishing up, not many buyers around - expect further weakness at least.
No. 4. An increase in selling this day broke the previous couple of days lows - not good.
No. 5 & 6. Another two days that no buyers are around - indicated by low volume on these up days, expect further weakness.
No. 7. Another big volume day, huge amount of selling, but with some buying again - indicated by the close of the day.
Today. Went ex div, another huge amount of selling, but the spread of the day has narrowed slightly, also on huge volume closing off the lows - indicating more buying, the end may not be far away, POSSIBLY.
The next thing to do is quite obviously we have to wait for this selling to end and that will be illustrated by low volume down days ( NOT like those low volume UP days No. 3, 5 & 6) This will mean we are looking for a lack of selling compared to a lack of buying. Confused yet ? Hopefully I haven't been too confusing. lol all holders

- Forums
- ASX - By Stock
- HLS
- pry - chart
pry - chart
-
- There are more pages in this discussion • 28 more messages in this thread...
You’re viewing a single post only. To view the entire thread just sign in or Join Now (FREE)
Featured News
Add HLS (ASX) to my watchlist
 (20min delay) (20min delay)
|
|||||
|
Last
$1.76 |
Change
0.005(0.29%) |
Mkt cap ! $1.274B | |||
| Open | High | Low | Value | Volume |
| $1.76 | $1.80 | $1.74 | $6.800M | 3.829M |
Buyers (Bids)
| No. | Vol. | Price($) |
|---|---|---|
| 6 | 29230 | $1.75 |
Sellers (Offers)
| Price($) | Vol. | No. |
|---|---|---|
| $1.76 | 500 | 1 |
View Market Depth
| No. | Vol. | Price($) |
|---|---|---|
| 1 | 4000 | 2.000 |
| 1 | 5 | 1.780 |
| 2 | 3520 | 1.750 |
| 1 | 3510 | 1.740 |
| 1 | 3000 | 1.735 |
| Price($) | Vol. | No. |
|---|---|---|
| 1.700 | 41 | 2 |
| 1.745 | 17 | 1 |
| 1.750 | 20 | 1 |
| 1.775 | 1422 | 1 |
| 1.780 | 14266 | 2 |
| Last trade - 16.10pm 03/09/2024 (20 minute delay) ? |
Featured News
| HLS (ASX) Chart |


