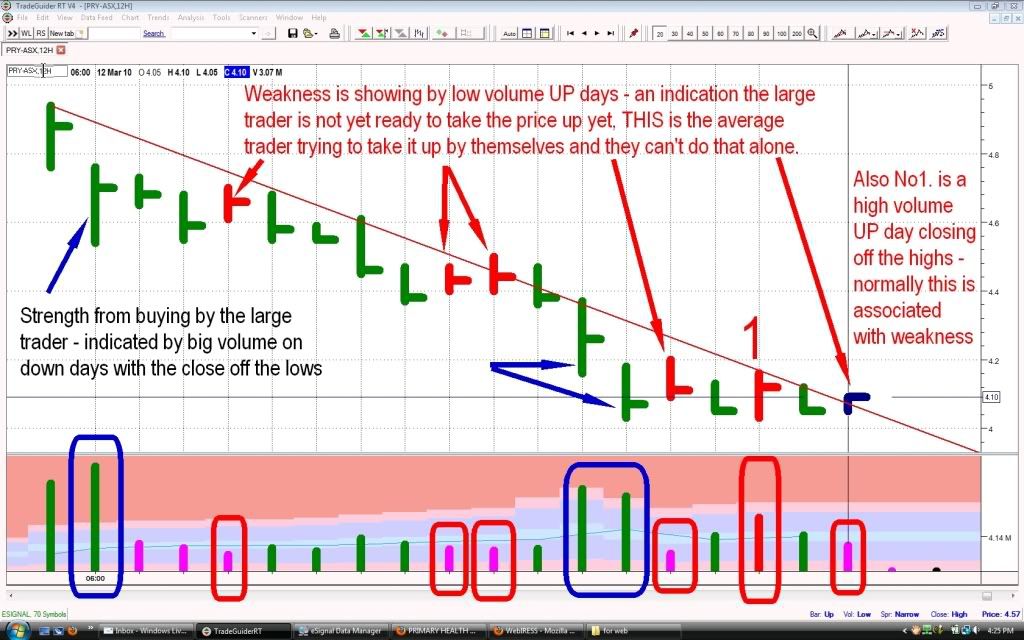
Here's my updated chart of PRY as promised, notice I am only looking at the last month since the big drop not too long a time frame.
Strength can be seen on about four occasions, this is when one or more big money groups have possibly decided to accumulate some more because the price seemed attractive.
But following most of these days has been signs of weakness from the large trader that they are not yet ready to move the price higher, this is seen by low volume UP days which is normally the average trader trying to move the price up by themselves.
Last weeks Monday began looking weak, as you can see a low volume UP day and finishing low on the day, following by an increase in volume to the down closing low. Wednesday was an interesting one, a high volume UP day closing off the highs normally is a sign of weakness, a sign of some offloading perhaps, following by a low finishing day. Friday tried to go up, but again on low volume, another sign of no interest from the larger trader.
imho I think because of the plateauing effect over the last week with several weak days, well actually all of them look weak, especially Wednesday not sure about that one, I think we maybe in store for further downward movement in the ST, could be completely wrong, but that's the way it is looking in the ST.
- Forums
- ASX - By Stock
- HLS
- pry - chart
pry - chart, page-12
-
- There are more pages in this discussion • 17 more messages in this thread...
You’re viewing a single post only. To view the entire thread just sign in or Join Now (FREE)
Featured News
Add HLS (ASX) to my watchlist
 (20min delay) (20min delay)
|
|||||
|
Last
$1.71 |
Change
-0.045(2.56%) |
Mkt cap ! $1.274B | |||
| Open | High | Low | Value | Volume |
| $1.73 | $1.73 | $1.71 | $257.5K | 149.7K |
Buyers (Bids)
| No. | Vol. | Price($) |
|---|---|---|
| 11 | 13226 | $1.71 |
Sellers (Offers)
| Price($) | Vol. | No. |
|---|---|---|
| $1.72 | 13385 | 14 |
View Market Depth
| No. | Vol. | Price($) |
|---|---|---|
| 5 | 1358 | 1.715 |
| 10 | 13751 | 1.710 |
| 9 | 21325 | 1.705 |
| 23 | 97845 | 1.700 |
| 7 | 59213 | 1.695 |
| Price($) | Vol. | No. |
|---|---|---|
| 1.720 | 3069 | 6 |
| 1.725 | 26540 | 14 |
| 1.730 | 48405 | 13 |
| 1.735 | 11421 | 7 |
| 1.740 | 60640 | 9 |
| Last trade - 10.24am 04/09/2024 (20 minute delay) ? |
Featured News
| HLS (ASX) Chart |


