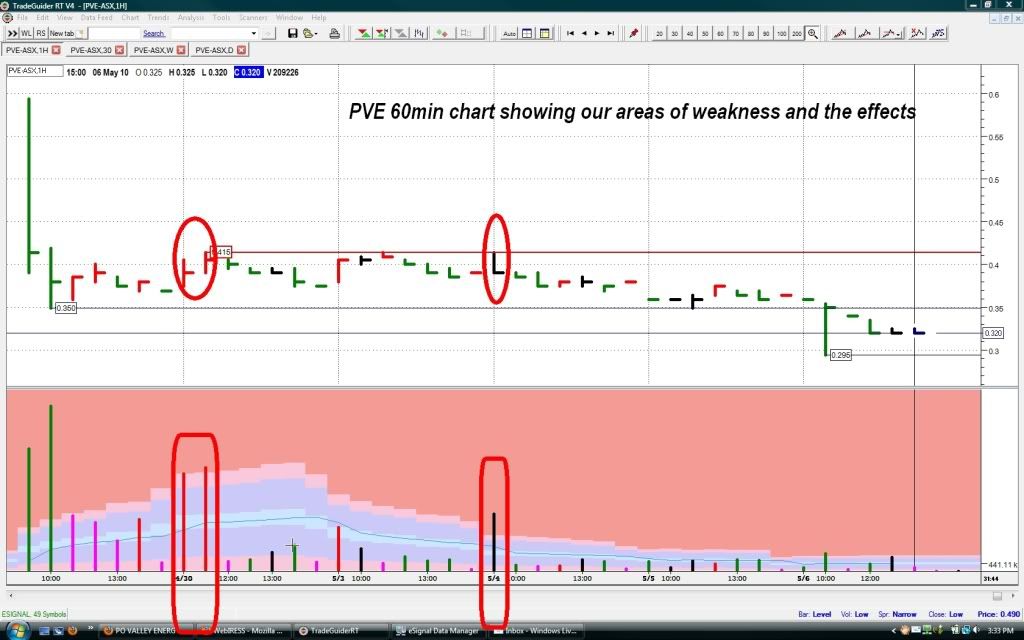
Thanks for your comments burnett and saylor, feel all warm and fuzzy now :)) seriously thou the analysis has been helped by the general markets but putting all of that aside we can see that PVE has broken down below the lows of the big drop.
Unfortunately the bounce back up to the 41cent level was ambushed by some serious selling on a couple of occasions and now we are seeing the effect which is slowly breaking us down. Now what I would be looking out for is if there is any more weakness coming our way which could be in the shape of High volume up bars that don't go anywhere or close low like the one two days ago - they tend to stand out and are quite easily spotted.
For the tide to turn imo I would wait for some higher highs and lows and none of the weakness as described above. Sometimes I find it easier to pan down inside the days bar - gives you a jump start sometimes.
- Forums
- ASX - By Stock
- PVE
- pve chart 6may
PVE
po valley energy limited
Add to My Watchlist
6.98%
 !
4.0¢
pve chart 6may
Featured News
Add to My Watchlist
What is My Watchlist?
A personalised tool to help users track selected stocks. Delivering real-time notifications on price updates, announcements, and performance stats on each to help make informed investment decisions.
 (20min delay) (20min delay)
|
|||||
|
Last
4.0¢ |
Change
-0.003(6.98%) |
Mkt cap ! $46.35M | |||
| Open | High | Low | Value | Volume |
| 4.2¢ | 4.2¢ | 4.0¢ | $29.76K | 727.3K |
Buyers (Bids)
| No. | Vol. | Price($) |
|---|---|---|
| 6 | 669159 | 4.0¢ |
Sellers (Offers)
| Price($) | Vol. | No. |
|---|---|---|
| 4.4¢ | 100000 | 1 |
View Market Depth
| No. | Vol. | Price($) |
|---|---|---|
| 5 | 639159 | 0.040 |
| 2 | 750000 | 0.039 |
| 1 | 263157 | 0.038 |
| 2 | 167857 | 0.035 |
| 1 | 300000 | 0.033 |
| Price($) | Vol. | No. |
|---|---|---|
| 0.044 | 100000 | 1 |
| 0.045 | 49999 | 1 |
| 0.046 | 50000 | 1 |
| 0.050 | 99940 | 1 |
| 0.052 | 89999 | 1 |
| Last trade - 16.10pm 16/09/2025 (20 minute delay) ? |
Featured News
| PVE (ASX) Chart |


