well things are getting interestinger and interestinger in the fibonacci time world. in 2010 we saw a double bottom mid year. May 21st was the XJO low and July 1 was a double bottom higher low for the XJO but was the year low for the US. A day count from 1/7/2010 to the Friday Feb 18th high in the US was 232 days...so the saturday would have been fib 233 days. A 38.2% time extension from the Feb 18 high will bring us within a day of my 1.618 time extenion of the 495 day XJO GFC bear market due on May 21 date which I have for a year now been predicting as a major date for the XJO. And a 50% time extension brings us to within a day of the Armstrong 8.6 year cycle low which is also the 1.618 time extension for the US 512 day GFC bear market.
I have been suspecting that these 2 dates will be a double bottom being so close to the Armstrong low. This chart is just a little more circumstantial evidence for my case as the due dates approach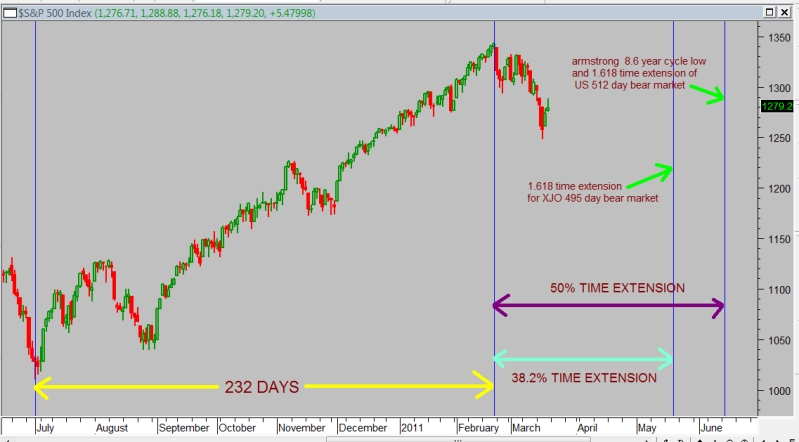


Add to My Watchlist
What is My Watchlist?
 (20min delay) (20min delay)
|
|||||
|
Last
8,807.1 |
Change
-24.300(0.28%) |
Mkt cap ! n/a | |||
| Open | High | Low |
| 8,831.4 | 8,831.4 | 8,790.3 |
| XJO (ASX) Chart |