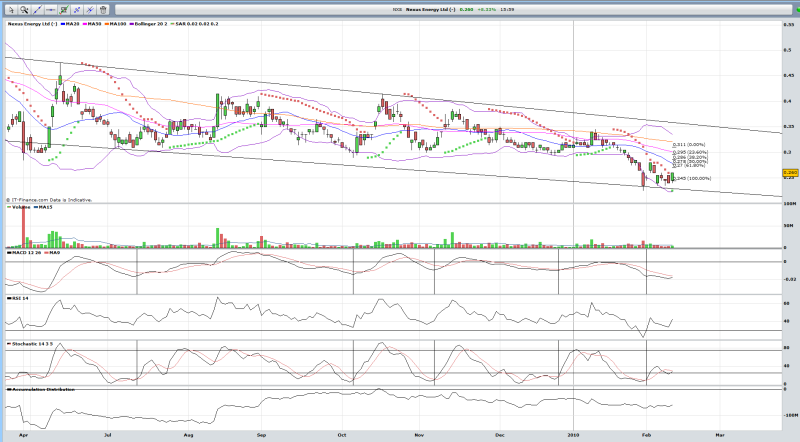
A summary of some of the trades that push the SP up by $0.05 movements pushing NXS up 6.25%:
Trades: 212 - 263 3:44:56 pm
SP: 25.5
Volume: 975,063
Amount:$248641
Trades: 102 - 152 2:30:00 pm
SP: 25
Volume: 1,321,459
Amount: $330365
Trades: 35 - 87 12:21:02 pm
SP: 24.5
Volume: 1,161,119
Amount: $284474
Volumes small, although the buying is encouraging to wipe out the walls between $0.245-$0.255. Someone is keen, accumulation perhaps, or simply it could be one of the many brokers that may have recommended a buy. Perhaps a reversal is within our midst? My SAR parabolic indicator have light up, with Stochs and MACD possibly crossing. Volume is not there.
At this levels it seems risky to short, but with European nervousness and Crux deal being a draggy lingering wait in the shadows. Fear could undermine this reversal.
And in reply to Maelstrom, I assume you derived the $70m Profit p.a figure from a recent broker recommendation. By definition Profit = Total income or cash flow minus expenditures. However, I assume their projected figure of $70m (maybe abit high in my opinion) is income derived solely from LT, and is yet to deduct administration, development, exploration, loyalties, interest and debt repayments. Once deducted, the expenses should be mitigated by the income hence the low risk nature of NXS, and the huge upside we have if CRUX is pulled off.
In addition i have included a Chart for those interested:
Points:
- The parabolic SAR is represented by the green (bullish) or red (bearish) dots that signal expected momentum to either be up, or down. It helps gauge the stock direction confirmed by other indicators. In this case it indicates a possible reversal
- Both MACD and Stochastic looking to cross!
- Stochastic and lower boiler bands indicates an oversold position; oversold positions may keep being oversold, until further indicators point to a change in direction, hence above
- Long term downward trend needs to be broken
- No strong volumes
Other
- Latest news of Greece bailout appears limited by the EU, this is under expectation of investors, hence fear, hence potential red days to come after the last 2 day technical rebounds... and we know how NXS reacts to bad overall market sentiment!
- Some good data coming out from the US, however sustainability is an issue
- Snow storms in the US, should see stable or higher gas prices ST
- Recovering aussie economy signalled by job growth
- Greener clear technology in Australia? New legislations? Perhaps gas demand will look brighter in the near future
- News ahead: CEO appointment, farm outs, CRUX
Interesting times ahead. Trade and invest carefully.
All the best to all holders
LM
- Forums
- ASX - By Stock
- NXS
- rebound
rebound, page-17
-
-
- There are more pages in this discussion • 4 more messages in this thread...
You’re viewing a single post only. To view the entire thread just sign in or Join Now (FREE)
Featured News
Add NXS (ASX) to my watchlist
 (20min delay) (20min delay)
|
|||||
|
Last
15.5¢ |
Change
0.000(0.00%) |
Mkt cap ! $45.28M | |||
| Open | High | Low | Value | Volume |
| 16.0¢ | 16.0¢ | 15.5¢ | $6.303K | 40.65K |
Buyers (Bids)
| No. | Vol. | Price($) |
|---|---|---|
| 2 | 6575 | 15.5¢ |
Sellers (Offers)
| Price($) | Vol. | No. |
|---|---|---|
| 16.0¢ | 21952 | 1 |
View Market Depth
| No. | Vol. | Price($) |
|---|---|---|
| 2 | 6575 | 0.155 |
| 2 | 82688 | 0.150 |
| 2 | 56000 | 0.145 |
| 2 | 98500 | 0.140 |
| 2 | 10700 | 0.135 |
| Price($) | Vol. | No. |
|---|---|---|
| 0.160 | 21952 | 1 |
| 0.170 | 12689 | 1 |
| 0.175 | 19500 | 1 |
| 0.195 | 5000 | 1 |
| 0.200 | 11820 | 1 |
| Last trade - 16.10pm 08/11/2024 (20 minute delay) ? |
Featured News
| NXS (ASX) Chart |
The Watchlist
EQN
EQUINOX RESOURCES LIMITED.
Zac Komur, MD & CEO
Zac Komur
MD & CEO
SPONSORED BY The Market Online


