http://club.ino.com/trend/analysis/equity/NASDAQ_MESO
ANALYZE SYMBOL
Stock Trend Analysis Report
Prepared for you on Wednesday, August 10, 2016.
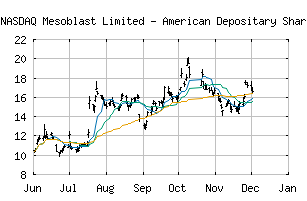
MESOBLAST LTD ADS (NASDAQ:MESO)
Smart Scan Chart Analysis is showing some near term weakness. However, this market remains in the confines of a longer term Uptrend with tight money management stops.
The Trade Triangles are generated using a proprietary algorithm that is comprised of weighted factors that include, but are not limited to - price change, percentage change, moving averages, and new highs/lows. The MarketClub trading strategy is based on the triangles, learn more here.
Open High Low MESO Price Change
4.41 5.18 4.41 4.94 +0.66
ENTRY SIGNAL
MarketClub’s Trade Triangles for MESO
The long term trend has been DOWN since Jun 14th, 2016 at 6.52
The intermediate term trend has been UP since Jul 26th, 2016 at 4.34
Smart Scan Analysis for MESO
Based on a pre-defined weighted trend formula for chart analysis, MESO scored +70 on a scale from -100 (strong downtrend) to +100 (strong uptrend).
http://club.ino.com/trend/analysis/equity/NASDAQ_MESO...


Add MSB (ASX) to my watchlist
 (20min delay) (20min delay)
|
|||||
|
Last
$1.26 |
Change
-0.050(3.83%) |
Mkt cap ! $1.432B | |||
| Open | High | Low | Value | Volume |
| $1.27 | $1.30 | $1.17 | $21.32M | 17.21M |
Buyers (Bids)
| No. | Vol. | Price($) |
|---|---|---|
| 4 | 5460 | $1.25 |
Sellers (Offers)
| Price($) | Vol. | No. |
|---|---|---|
| $1.26 | 978 | 1 |
View Market Depth
| Last trade - 16.10pm 24/07/2024 (20 minute delay) ? |
| MSB (ASX) Chart |