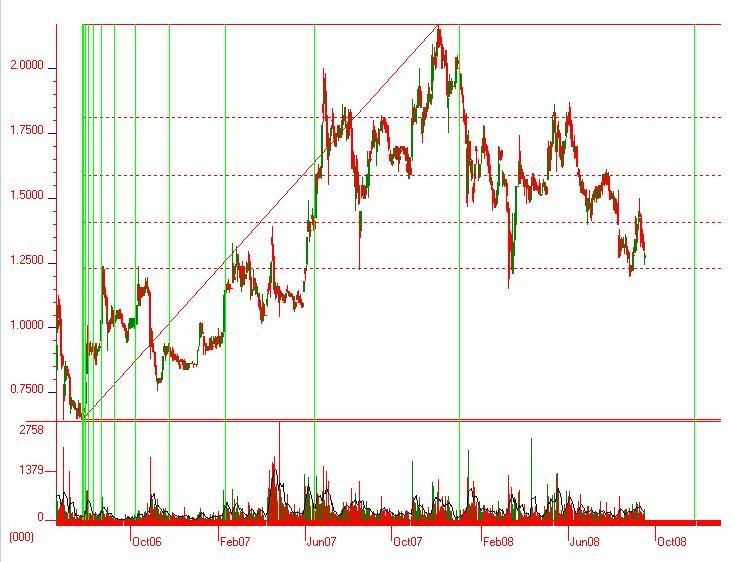
The following Fib time zone lines (green) demonstrate a point - the SP does tend to follow this accursed golden ratio. As can be seen, the significant movements occur near the Fib intervals. Some trending stocks follow this ratio, some do not - I reckon it's all the bloody scientists and academics who follow the company...
The chart above also displays the Fib retracement lines you have been discussing. It is quite clear that this series is neither as coherent nor as accurate as the other Fib measurements that could be applied to the SP, though the 23.6% retracement did provide a general zone of resistance from mid-May to early June, and the 61.8% line provided a general zone of support around mid-March.
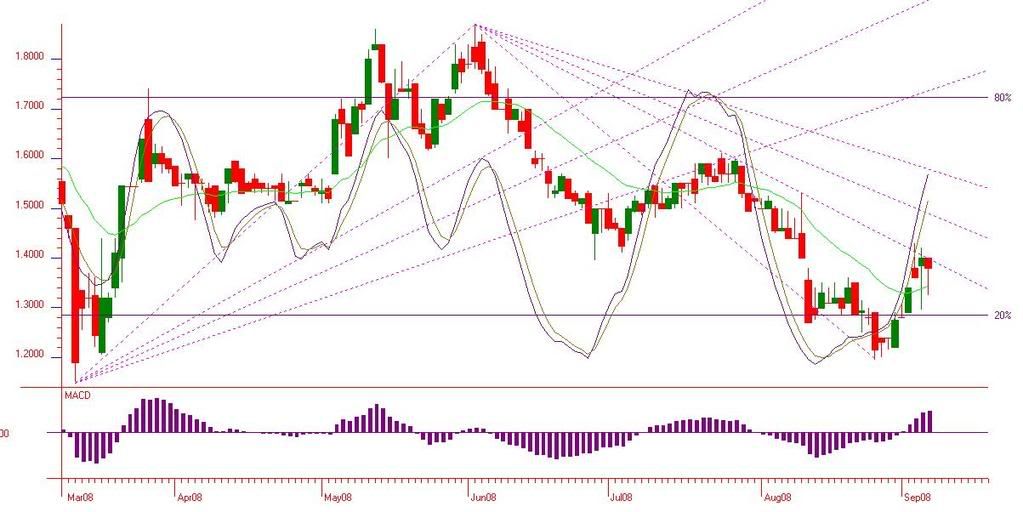
The price seems to be more influenced by the fan lines than the retracements levels and lines. Perhaps the heaviest GDY trader/s use this as their choice of ratio indicators? The following chart is a few days old, though it does demonstrate the SP's inclination to 'stick' to those fan lines:
Bearing that in mind, the following Fib fans indicate that we are at a support level, if only a minor one.
I included the Bollinger bands because the strongest indicators so far have been reversal candles outside the bands. Look back and you can find hanging men and hammers at most of the major reversals. Unfortunately, the last decisive candle was the shooting star on the 9th, and in combination with the other indicators, which do seem to be negative, I've got to agree with you that this looks like it could have further to fall on the back of festering American markets, though I would argue that the 61.8% line was the most significant in the past, and will provide the lowest level of this correction as the point of intersection for the relatively strong 38.2 and 50 Fib fan lines. The last intersection of the retracement and fan lines marked the exact point of reversal at 161c.
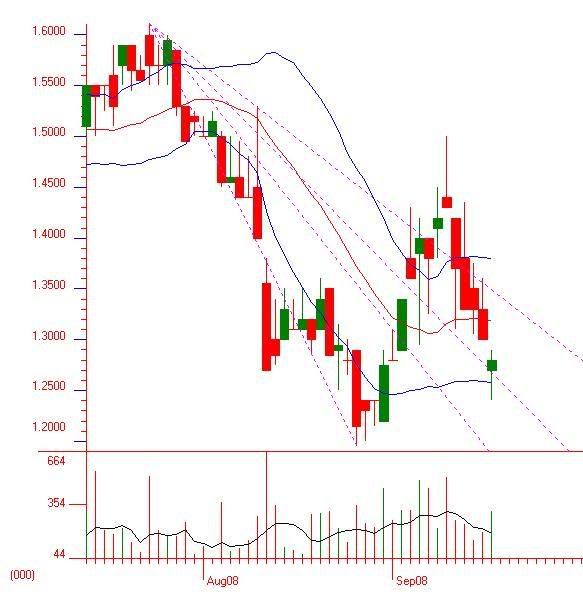
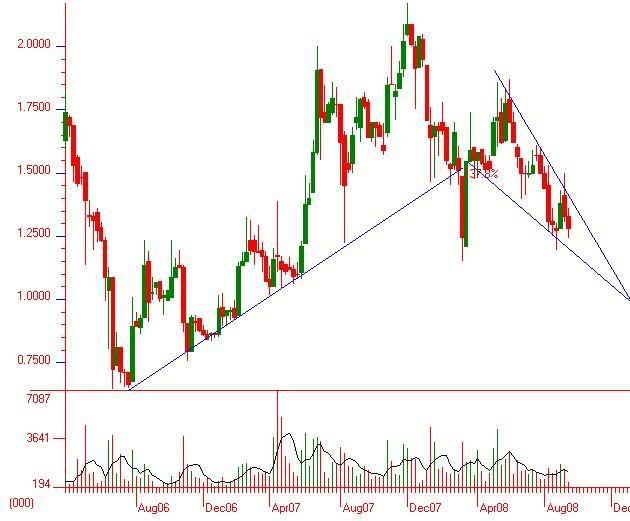
119.5c marks the recent low and the current lower boundary of the descending wedge forming on the weekly chart (shown below). Could be a chance for support right there, though if the SP stagnates, the wedge terminates right at the 78.6% line (coincidence?). Perhaps the determining factor will be proven viability in the flow tests?
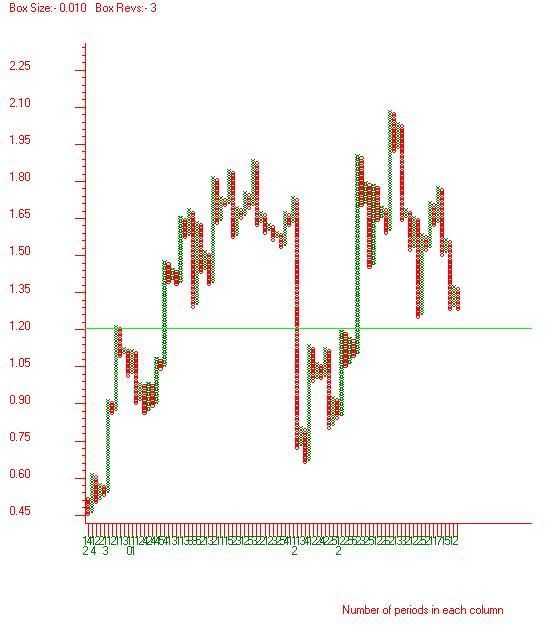
The image I get is that it would take negative flow test data to bring this below 98c. There seems to be a confluence of patterns and indicators around 119c then the 98c area. One last chart to consider is the following P&F chart for GDY, demonstrating the strength of the 119c area.
My point in focus is that there seems to be plenty of support to suggest that a 100% retracement to 65c is a pipe dream (get it?....dry lol)
Cheers
tawnyport
RNE Price at posting:
$1.26 Sentiment: LT Buy Disclosure: Held
A personalised tool to help users track selected stocks. Delivering real-time notifications on price updates, announcements, and performance stats on each to help make informed investment decisions.


 (20min delay)