Australian Vintage's share price has jumped 6% today in expectation of the earnings release.
A quality growing business has gone largely unnoticed in the shadow of Treasury Wine Estates' success.
It has been a transformative year with mixed announcements that kept a lid on the share price.
Dividends reintroduction is on the cards, if not this then the next year.
All eyes have been on Treasury Wine Estates [ASX:TWE] (OTCPK:TSRYY) reporting their earnings earlier last week. And the shareholders had a party, oh yes they did - the upbeat results with the very respectable growth across all areas. Meanwhile, Australian Vintage Limited [ASX:AVG] (OTC:AUVGF), a leading Australian wine company, albeit a smaller one, is due to release its results today. So what can we prepare ourselves for?
To be fair, let me begin by saying that this is not an 'apples to apples' comparison: TWE is the constituent of the ASX 200 and is one of the largest listed wine companies in the world. With the latest market cap (all dollar figures will be in AUD unless otherwise noted) of $8.27B. TWE looks enormous comparing to AVG's $134M market cap. In addition, TWE is rather more diversified with the collection of Australian, American as well as European wine brands.
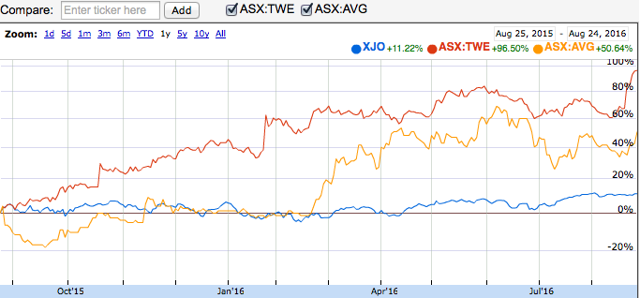
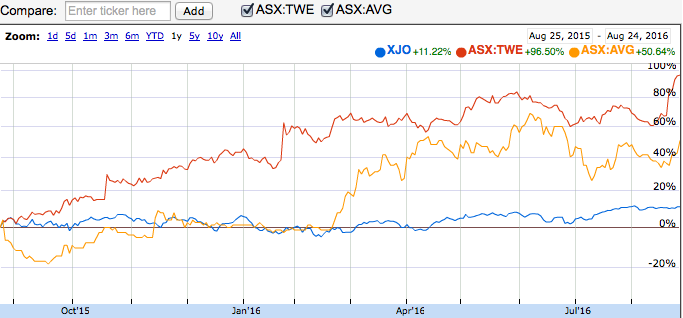
Nevertheless, both companies have delivered some decent returns to their investors: TWE is up 96% and AVG is up 50% since a year ago - nice! With the ASX 200 up a good 11% in the same time period there is no reason to complain.
Chart source: Google Finance
So, what do we know so far?
How it started
AVG had a rough start for the financial year feeling the effects of higher 2014 vintage costs and scrapping the dividends. A bunch of yield-hungry investors took heed abandoning ship and boarding TWE, presumably. Oh yes, you can't blame them, the above chart serves as a good evidence. The result was a significant drop in AVG's share price in Aug-Sep 2015.
Onerous Agreements and costs
Costs have been and continue to be encumbered by some older lease agreements and contracts. These are the onerous contracts with the above market grape prices. The company had taken steps to move out of these arrangements and decided to terminate the Del Rios lease paying $9.7M after tax for early termination and costs write off (subsequently reduced by $0.5M from recovered legal costs). This has resulted in a AUD6M loss after the one-off items for the half year ending 31 December 2015.
It took time for investors to digest the original lease termination announcement made in November 2015, but once the payment cleared in late February, the shares rallied delivering the majority of this year's gains.
As the company reported its Half Year Results announcement, the future benefits of this termination far outweigh the costs incurred: In November 2015 Australian Vintage Limited served notice to the owners of the Del Rios vineyard toterminate the lease on this vineyard. The effective date of termination was 31 December 2015. Thelease was due to expire after the 2023 vintage but was terminated early under the provisions in thelease. The early termination delivers a material financial benefit to the Company. Based on the 2015average price for grapes in the appropriate region, the net benefit is $35 million over the original leaseterm.
More to it, in the same Announcement, the company noted that the remainder of the onerous contracts are due to expire soon (emphasis added is mine): Our biggest issue over the last ten years has been the onerous nature of most of our grape contractsand vineyard lease agreements. However, with the recent termination of the Del Rios vineyard leaseand the near term expiry of some of our 'above market' priced grower contracts, we expect asignificant reduction in our future grape costs. This will also result in a reduction in our inventory.
Can we now hope to be out of the woods? Not quite, I'd say, as apparently there are still a number of 'above market' grape contracts expiring after 2012. However, we should be starting to see some light now which is yet to be evidenced from the more pronounced improvement in margins.
Brexit
Brexit, or more accurately the unfavourable movement of the British Pound against the Aussie Dollar, has had an adverse effect on the company's earnings, accounting for circa $1.0M in unrealised foreign exchange loss as at June 30th. According to the company's Half Year presentation, GBP is the largest foreign currency exposure and UK/Europe contributing up to 45% in total sales. Ouch, that bites - say goodbye to an earlier expected net profit increase of 10% on last year's results.
On the same issue, TWE reported no material impact from Brexit with only 10% of sales derived from the UK market. And guess what, GBP continues its decline, now buying 1.7AUD vs. 2AUD 6 months ago. However, my takeaway on this development is that the impact of lower AUD should more than offset the recent decline in GBP. For this instance, TWE reported a positive net effect of currency flows and hedging of $41M for the year.
Of course, TWE has a much greater portion of cash flow benefiting from USD strength. Therefore, we cannot expect the same from AVG, but at least I expect a 'net off' effect. It doesn't give peace of mind though, since was it not the tailwinds from lower AUD that brought some investors to this shore? Certainly not the main consideration for investing in Aussie exporters and there are many other good reasons to invest in the Australian wine industry in particular, but just look at the price action of AVG post 'Brexit' announcement - this has put a strong lid on the stock price.
Growth
Meanwhile, under the surface of mixed announcements, the company continued to execute its strategy: growing branded sales and export business. By the end of April 2016, total sales were up 8% on last year with the branded sales growing at 20%. As at 31 Dec. 2015, three main brands represented 65% of total sales comparing to 56% a year ago and 37% in Dec. 2010 - worth taking notice.
However, this looks pale in comparison to Treasury Wine's latest stellar results - sales up by 18.9% and the net profit up a whopping 131.2%.
So, let's have a closer look by segment:
Column 1
Column 2
Column 3
Column 4
Column 5
Column 6
Column 7
Column 8
Column 9
Column 10
Column 11
0
ASX:TWE
ANZ
Asia
Europe
Americas
Total Group
1
FY
16
15*
16
15*
16
15*
16
15*
16
15*
2
Net Sales Revenue* $M
590.7
585.5
293.2
209.9
357.7
314.3
991
862.5
2232.6
1972.2
3
Sales growth
0.9%
39.7%
13.8%
14.9%
13.2%
4
Sales contribution%
26.5%
29.7%
13.1%
10.6%
16.0%
15.9%
44.4%
43.7%
100.0%
100.0%
5
6
EBITS* $M
92.3
85.5
102
70.6
47.7
37
136.3
108.8
342
266.1
7
EBITS growth
8.0%
44.5%
28.9%
25.3%
28.5%
8
EBITS contribution %
27.0%
32.1%
29.8%
26.5%
13.9%
13.9%
39.9%
40.9%
100.0%
100.0%
9
10
EBITS margin %
15.6%
14.6%
34.8%
33.6%
13.3%
11.8%
13.8%
12.6%
15.3%
13.5%
11
· Net Sales Revenue excludes other revenue. Total EBITS have been adjusted for corporate segment costs. Restated numbers have been used for FY2015 per 2016 annual results presentation. · EBITS stands for earnings before interest, tax, SGARA and material items, where SGARA is the net effect of fair value of self-generating and regenerating assets
The above table is prepared by myself based on TWE's latest annual report and investor presentation.
Hope you are paying attention to the numbers delivered by the Asian segment: 13.1% of net sales generating almost 30% of total EBITS. More to it, only the Asian segment has expanded its share of both revenues and earnings. Exceptionally high EBITS margin is the answer, 34.8%, more than double of the other segments and the group total - highly lucrative market for the winemakers.
Hats off to Treasury Wine for making the best of it thanks to the apt management for turning around the company in the span two years, and of course, to the generation of Asian wine drinkers, among others, who continue to develop their taste for imported reds and whites.
Take the Asian segment out of the equation and the picture will be critically different. But the good news is that, according to VINEXPO and IWSR, Asia's wine drinking habits are only forecasted to get bigger, with still low consumption per capita and the upbeat numbers on wine imports to China where Australian wine imports have grown by 47.8% in 2015.
Okay, let's now turn and see what Australian Vintage holds in store:
Column 1
Column 2
Column 3
Column 4
Column 5
Column 6
Column 7
Column 8
Column 9
Column 10
Column 11
0
ASX:AVG
Australasia/Nth America packaged
UK/Europe packaged and bulk
Cellar Door
Australasia/Nth America bulk & processing
Total (adjusted to include the vineyards' results)
1
2
Half year Ended 31/12/2015
Half year Ended 31/12/2014
Half year Ended 31/12/2015
Half year Ended 31/12/2014
Half year Ended 31/12/2015
Half year Ended 31/12/2014
Half year Ended 31/12/2015
Half year Ended 31/12/2014
Half year Ended 31/12/2015
Half year Ended 31/12/2014
3
FY
4
Sales $'000
57,379
51,368
58,196
55,185
4,245
4,007
8,072
8,412
129,756
121,669
5
Sales growth
11.7%
5.5%
5.9%
-4.0%
6.6%
6
Sales contribution%
44.2%
42.2%
44.9%
45.4%
3.3%
3.3%
6.2%
6.9%
100.0%
100.0%
7
8
EBIT $'000
3,747
3,251
3,743
1,905
827
745
-314
-27
8,180
6,315
9
EBIT growth
15.3%
96.5%
11.0%
N/A
29.5%
10
EBIT contribution %
45.8%
51.5%
45.8%
30.2%
10.1%
11.8%
-3.8%
-0.4%
100.0%
100.0%
11
12
EBIT margin
6.5%
6.3%
6.4%
3.5%
19.5%
18.6%
-3.9%
-0.3%
6.3%
5.2%
The above table is prepared by myself based on AVG Half Year Report ending 31 Dec 2015 and investor presentation.
We are only using the half year results as it is what we have as of now. However, the situation gets harder as there is no clear information by geographical segment. Instead, we have Australia, NZ, Asia and North America 'jumbled up' in the first reporting segment, the UK and Europe squashed together in the second - doesn't help much. Cellar Door and Australasia/N America bulk & processing are representing the other two, albeit much smaller segments.
Therefore, it is difficult to make some meaningful comparison on these grounds. I do hope, however, for some greater clarity in regards to geographical segmentation coming up from the company as they focus on driving branded sales across regions and will likely require a more targeted approach and transparency in reporting.
Nevertheless, we can see some outstanding EBIT growth of 96% from UK/Europe year on year, whereas sales only grew at 5.5%. This was spurred by the EBIT margin increase from 3.5 to 6.4% - quite significant, especially knowing the popularity Australian Vintage has achieved with its McGuigan brand in the UK.
Australasia/N America packaged segment has grown sales by 11.7% and EBIT by 15.3% on the back of slightly improving margin to 6.5%. For this segment, the company gives a breakdown of sales growth by division, explaining the sales expansion came from 8% growth in Australian sales, 26% growth in sales to Asia, 28% increase in sales to N America and a slight decline of 2% in sales to NZ.
While we don't know the actual mix, it appears that both N America and Asia represent just 10% of total sales according to information in 2015 annual report. It is certainly worth noting that N American and Australian sales growth comes above TWE's numbers, whereas Asian sales growth achieved by TWE wasn't surpassed. I believe, these two regions represent the highest growth potential for the company going forward.
Cellar Door, a retail segment much smaller in size representing just over 3% in sales, has also grown both top and bottom lines with the highest EBIT margin of 19.5%. The bulk & processing segment has had a negative contribution to earnings which I expect to continue as the company shifts focus on differentiation towards branded sales.
All in all, while we see significantly lower earnings margins compared to TWE, these are expanding which is a good sign. Also there is respectable growth in both sales and earnings across the main segments.
Inventories.
It is understandable that you are going to see inventories representing a great share of winemakers' assets. However, let's analyse it:
AVG (based on 2015 annual report): Total inventory (current and non-current) represent 42% of total assets. Days inventory outstanding (DIO) = 414 days. Inventory composition: 16% non-current and 84% current. 78% of total inventory is bulk wine.
TWE (based on latest 2016 report): Total inventory (current and non-current) represent 29% of total assets. Days inventory outstanding (DIO) = 340 days. Inventory composition: 43% non-current and 57% current. 25% of total inventory is commercial wine, 25% - in masstige (mid-priced wine) and 50% in luxury (upper priced wine).
At a quick look, it becomes obvious that Australian Vintage has proportionally larger and slower moving inventory. Whether it is good or not very much depends on the business model, but it is quite universal - slower inventory means a longer cash conversion cycle and a negative effect on cash flows. Also, Treasury Wine has a larger part of inventory in non-current assets, which I presume is consistent with their focus on branded wines.
Indeed if we dig down their latest presentation, we find that 75% of the non-current inventory is in luxury wines. My Assumption is that Australian Vintage is still behind the curve in its strategy on increasing branded wine sales. Therefore, it is important to monitor the movement in their inventory and determine whether execution of strategy progresses accordingly.
Valuations.
This is where things are getting interesting. Australian Vintage is currently trading at 0.43 Price/Book and 0.55 Price/Sales - a paltry triviality compared to Treasury Wine's 2.14 P/B and 3.32 P/S. Treasury Wine's P/E is currently standing at a hefty 45 - rather high, no matter how you look at it. Apparently, investors are pricing in that the company will continue to improve margins and grow earnings.
Treasury Wine seems to be on track of these predictions. However, one should not discount the boost to profits the company received from the favourable currency rates. Will this repeat is the question TWE investors should ask themselves.
When it comes to Australian Vintage, I think the company didn't deserve such low valuations. Give or take, the company seems to be transforming itself under the surface of unfavourable news and announcements. Sales growth is quite promising and margins, albeit much lower than TWE, are improving.
On an EV/EBIT basis, AVG looks as a better value proposition. If we extrapolate 1st Half EBIT of $8.18 M to full year, which I think is close to reality, and take current Enterprise Value of $229 M ($134M in market cap + $100M debt - $5M cash), we'll get about 14. This is significantly lower than TWE's current EV/EBIT of 29 using the latest results and current market cap.
So, what should we be looking for in the earnings report and observe going forward?
Monitor margins as AVG transforms itself into a branded wine business.
Look for growing sales, in America and Asia in particular.
Keep an eye on the shift in inventories as the company needs to work through the current majority of its bulk wine.
Conclusion
It can be a rather lucrative growth market for the quality winemakers as Treasury Wine Estates' latest earnings have revealed; however, the execution of strategy remains paramount. Australian Vintage seems to present a good value at this price and it looks like the quality growing business has been underappreciated by investors and shadowed by Treasury Wine's success.
It might appear that Australian Vintage is somewhat behind the curve in its transformation if compared to Treasury Wine Estates, but shouldn't we agree that time to invest is when the growth is still nascent?
We'll need to look past the anticipated, and to a certain degree expected, bottom line numbers in this coming report and search for the signs of growth and transformation. If the signs prove that the company is on its track, we should see much higher valuations pretty soon. In addition, there is a clear possibility on the cards that the company will reintroduce the dividend. Let's see.
Disclosure:I am/we are long AUVGF.
I wrote this article myself, and it expresses my own opinions. I am not receiving compensation for it (other than from Seeking Alpha). I have no business relationship with any company whose stock is mentioned in this article.
Editor's Note: This article covers one or more stocks trading at less than $1 per share and/or with less than a $100 million market cap. Please be aware of the risks associated with these stocks.
25 people have AUVGF in their portfolio
Follow AUVGF
About this article:
Expand Recommended for you:
Column 1
Column 2
0
Teekay Has Hit BottomEugenio Miravete • Aug. 26, 2016 4:47 AM ET
Column 1
Column 2
0
Shocked! Mylan, Biotechs Swoon After Hillary's StatementDoctoRx • Aug. 26, 2016 5:27 AM ET
Column 1
Column 2
0
Sentiment Speaks: Silver Is Heading To $1,000Avi Gilburt • Aug. 26, 2016 2:09 AM ET
Column 1
Column 2
0
Chevron - Guaranteeing A Dividend IncreaseEli Inkrot • Aug. 25, 2016 2:39 AM ET
Comments (0)
Track new comments
Be the first to comment
pacestick
Before you comment, why not add your picture?
Add Your Comment:
Share your comment:
SURVEY
What is the biggest threat to financial security in retirement?
Inflation
Not enough savings
Insufficient investment returns
Government financial situation
Insufficient Pension / Social Security
Healthcare costs
Financial support of family members
Global market volatility
AVG Price at posting:
52.0¢ Sentiment: Buy Disclosure: Held
A personalised tool to help users track selected stocks. Delivering real-time notifications on price updates, announcements, and performance stats on each to help make informed investment decisions.


 (20min delay)