PDN
This share got my interest several months ago basically from a FA belief (shock horror; do not mention FA here!!) in uranium as a long term MUST for world going forward. Interesting for us with long memories (or is that just oldies?) who recall Uranium being the scourge of greenies back in the 80s/90s however now it is seen as the viable answer to energy probs when greenhouse is mentioned. How times change.
Anyway I have posted a no. of charts over the months & confess to never trading it. Worth noting that it is TA that has kept me from buying it at much higher prices than today. The old gj would have bought this with ears pinned back at much higher prices than today. & I did NOT know how to sell.
Fascinating chart IMO.
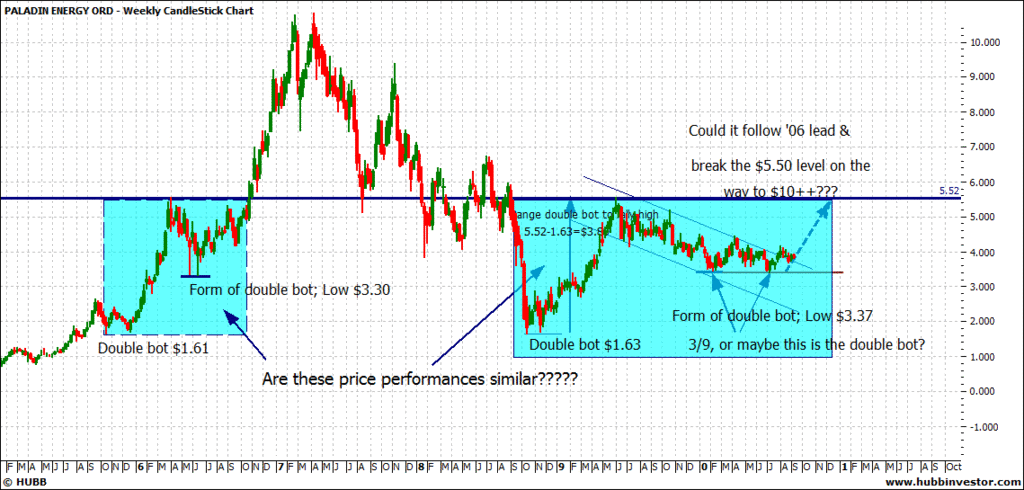
First a longer term view showing the run up to $10 in 2007 and subsequent GFC smash. This chart has a pattern that I noticed is perhaps repeating?
Eg
-a Double bot $1.61 in 2005 and Double bot $1.63 in 2010.
-a rally up to $5.54 in 06 and $5.52 in 09
- a form of double bot Low of $3.30 in 06 and a recent Form of double bot Low of $3.37
- time frame of pattern obviously very different!
So will we get a break of the $5.52 res triggering a move back to $10?
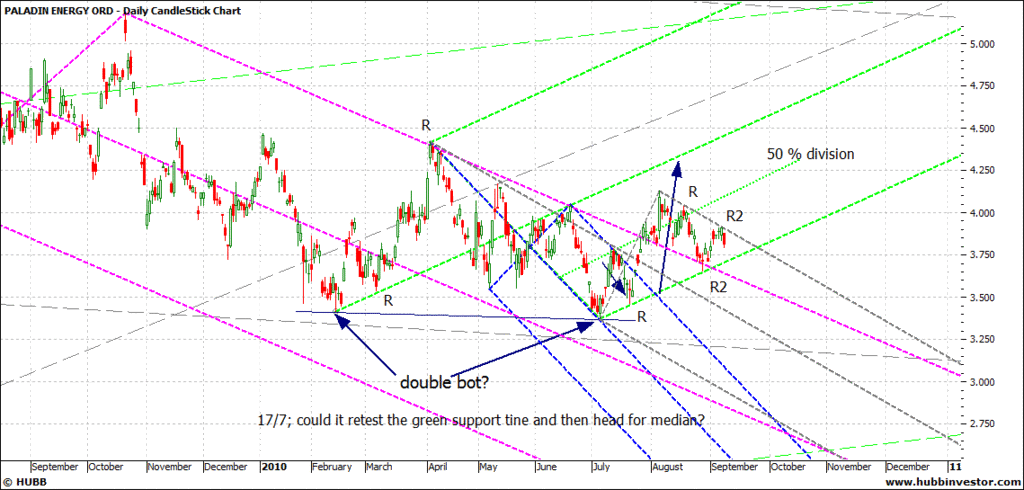
Lets look at a series of forks, from left to right:
-been travelling in d/t for 12 months in pink; recent break & back test
-green u/t fork confirmed with a Retest (R on chart) but as yet it has failed to get to med tine and has formed a second retest (R2). Interestingly it has until end of September to get to med tine within the expected Pivot Zone (p/f jargon)
-blue d/t fork interesting due to number of touches generally and confirmed move to med line specifically. Also note how pink res tine basically aligns with blue trigger line and of course it has been broken and back-tested. Very bullish?
-recent grey d/t p/f has had a double Retest (similar to green?) which could indicate move down to med.
Conclusion: damn interesting share & if looking for a trade:
1. a break north of grey res indicates:
Buy $3.90
Target: $4.50++ (green med tine)
Rew: 0.60, 15%
Stop $3.80 ish (break down grey res tine)
Risk: 0.10, 2.6%
Risk/Rew: 6
2. A break south of green support tine indicates:
Short $3.70
Target: $3.40 ish (grey med tine)
Rew: 0.30, 7.5%
Stop $3.80 ish (break up green sup tine)
Risk: 0.10, 2.6%
Risk/Rew: 3
Really welcome any comments on my analysis.
Gj
- Forums
- Charts
- september week 2
september week 2, page-40
-
- There are more pages in this discussion • 3 more messages in this thread...
You’re viewing a single post only. To view the entire thread just sign in or Join Now (FREE)


