TA Idiot ?
Cigararilli
Not sure what the meaning is, of
"Selling oneself short" in this recent market.
I think its a compliment as shorters were certainly winners.
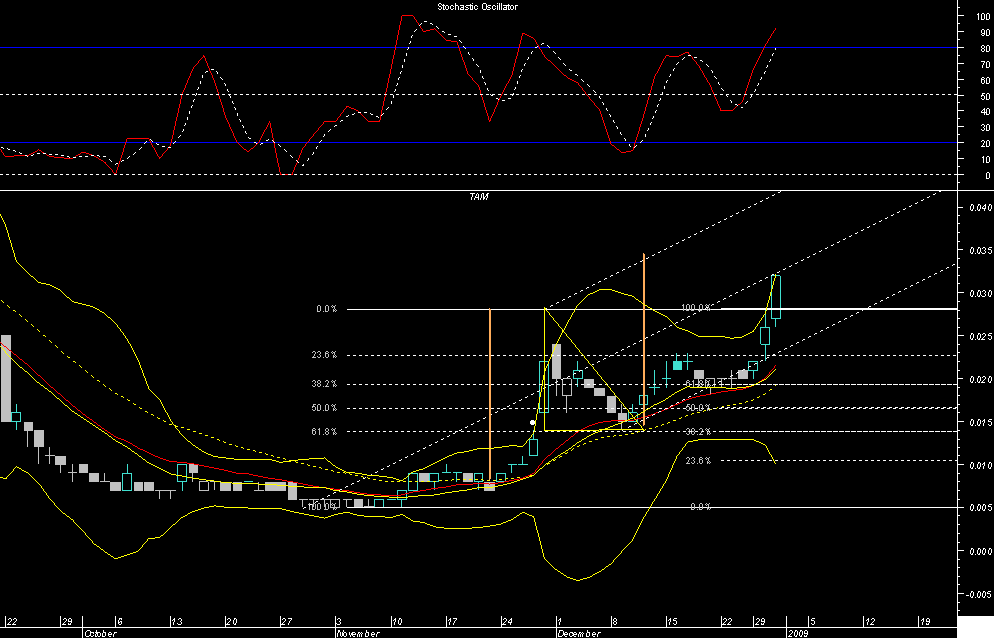
As a teacher you are no idiot and not many others would have noticed the close was outside the standard (close 14 simple Bollinger)
Yes the bollinger does suggest overbought when we backtest it on daily data.However when complimenting our indicators. the Andrews midline is not a completion in itself, It is just a midline target that "Andrews" suggested had very high odds of achieving.. and imo suggest a new bullish trend, see what you think of this reference....
from http://www.traderslog.com/andrews-pitchfork-indicator.htm
Dr. Andrews' rules state that the market will do one of two things as it approaches the Median Line: 1. Prices will reverse at the Median Line. 2. Prices will trade through the Median Line and head for the upper or lower parallel lines and then reverse. He suggested that prices make it to the median line about 80% of the time while the price trend is in place. This means that while the basic long-term price trend remains intact, Andrews believed that the smaller trends in price would gravitate toward the median line while the larger price trend remained in tact. Importantly, when that does not occur, it may be evidence that a reversal in the larger price trend may be under way.
When prices fail to make it to the median line from either side, it is often an expression of the relative bullish or bearish psychology of buyers and sellers, and may predict the next major direction of prices. If prices fail to reach the median line while above the median line, it is a bullish signal. If prices fail to reach the median line from below that line, then that is a bearish signal.
........
anyway it may be wise to maintain a tight stop and lock in some recent profits if broader market sentiment and gold fluctuations worry you..
If you look at the bollingers on a weekly basis they are still not overbought...
hmm hope this makes sense
Im a bit tired and emotional...lol
- Forums
- ASX - By Stock
- TAM
- shareholders and chart
shareholders and chart, page-12
-
- There are more pages in this discussion • 11 more messages in this thread...
You’re viewing a single post only. To view the entire thread just sign in or Join Now (FREE)
Featured News
Add TAM (ASX) to my watchlist
 (20min delay) (20min delay)
|
|||||
|
Last
2.9¢ |
Change
-0.001(1.69%) |
Mkt cap ! $34.07M | |||
| Open | High | Low | Value | Volume |
| 2.9¢ | 2.9¢ | 2.9¢ | $23.28K | 802.8K |
Buyers (Bids)
| No. | Vol. | Price($) |
|---|---|---|
| 1 | 58184 | 2.9¢ |
Sellers (Offers)
| Price($) | Vol. | No. |
|---|---|---|
| 3.0¢ | 148290 | 3 |
View Market Depth
| No. | Vol. | Price($) |
|---|---|---|
| 1 | 58184 | 0.029 |
| 5 | 917480 | 0.028 |
| 4 | 1050000 | 0.027 |
| 1 | 75000 | 0.026 |
| 3 | 1099120 | 0.025 |
| Price($) | Vol. | No. |
|---|---|---|
| 0.030 | 148290 | 3 |
| 0.032 | 267094 | 1 |
| 0.033 | 200000 | 1 |
| 0.034 | 577177 | 2 |
| 0.035 | 491178 | 2 |
| Last trade - 15.57pm 11/11/2024 (20 minute delay) ? |
Featured News
| TAM (ASX) Chart |
The Watchlist
3DA
AMAERO INTERNATIONAL LTD
Hank Holland, Executive Chairman and CEO
Hank Holland
Executive Chairman and CEO
Previous Video
Next Video
SPONSORED BY The Market Online


