thanks Rick64
first my disclaimer .... these are my thoughts only. maybe it won't go the way im interpreting the chart.
ok, looking at the 3 year weekly:
1. Looking at the stochastics, i have aslo shown 2 previous spots where the stochastics have given a buy signal.
2. looking at the MACD, i have also shown 2 previous occasions that have given buy signals. MACD is yet to cross zero so i have used a green line with blue line throught it to represent how we need it to go.
3. while a was putting on the green dots, i noticed some support. So i have just drawn 2 blue horizontal support lines that have held as support.
4. The bollinger band i use is the 10 day one. the share price has moved up from the bottom band and is moving towards / above the 10 day sma (we will find out at the end of the week)
5. Note this is the weekly chart only. current candle is not finished until friday.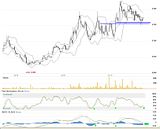
shhhhh!, page-5


Add RED (ASX) to my watchlist
 (20min delay) (20min delay)
|
|||||
|
Last
35.5¢ |
Change
0.010(2.90%) |
Mkt cap ! $2.414B | |||
| Open | High | Low | Value | Volume |
| 36.0¢ | 36.5¢ | 35.3¢ | $9.516M | 26.60M |
Buyers (Bids)
| No. | Vol. | Price($) |
|---|---|---|
| 8 | 331651 | 35.5¢ |
Sellers (Offers)
| Price($) | Vol. | No. |
|---|---|---|
| 36.0¢ | 409958 | 9 |
View Market Depth
| Last trade - 16.10pm 09/08/2024 (20 minute delay) ? |
| RED (ASX) Chart |