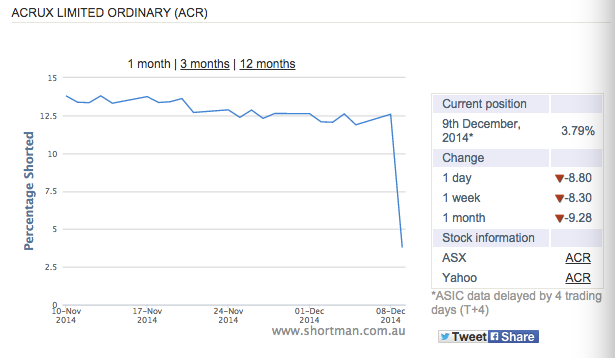
Can anyone please interpret this chart. what could this indicate?
Possibly an indication of good news in the near future?


Add to My Watchlist
What is My Watchlist?
 (20min delay) (20min delay)
|
|||||
|
Last
1.6¢ |
Change
-0.002(11.1%) |
Mkt cap ! $6.548M | |||
| Open | High | Low | Value | Volume |
| 2.0¢ | 2.0¢ | 1.6¢ | $39.34K | 2.216M |
Buyers (Bids)
| No. | Vol. | Price($) |
|---|---|---|
| 8 | 971151 | 1.6¢ |
Sellers (Offers)
| Price($) | Vol. | No. |
|---|---|---|
| 1.7¢ | 565000 | 1 |
View Market Depth
| Last trade - 16.10pm 31/07/2025 (20 minute delay) ? |
| ACR (ASX) Chart |