https://www.investing.com/analysis/week-ahead-200351382
Week Ahead: Will Earnings Disappointment Continue Pressuring Equities?
- All US benchmarks except the S&P 500 entered corrections
- Still, they remain above uptrend lines since the 2009 bottom
- VIX as well as safe haven yen, gold and yields signal lack of panic
At the end of one of the most volatile weeks for the market this year, the NASDAQ, S&P 500, Dow and Russell 2000 all finished lower. In addition, the technology rout deepened on Friday, temporarily pushing the S&P 500 Index into corrective territory.
Treasuries and gold rose as investors shifted out of equities and sought refuge elsewhere. The selloff was provoked by disappointing earnings reports and less robust than expected forward guidance from a few high profile companies including Amazon (NASDAQ:AMZN) and Alphabet (NASDAQ:GOOGL).
Communication Services, Tech Shares Weigh On SPX
On Friday, the S&P 500 Index fell 1.73 percent, dragged lower primarily by Communication Services (-2.71 percent) and Technology (-2.00) shares which have a heftier weighting on the benchmark, even though the Consumer Discretionary sector (-3.11 percent) led the underperformers. Ironically, Materials, which lost 0.59 percent, followed by Industrials, which fell 0.99 percent, both outperformed, even though they're the two sectors in the eye of the trade war storm.
On a weekly basis, the SPX extended its selloff, down an aggregate 3.94 percent, pressured by Energy shares (-7.06 percent) following a third straight weekly plunge in oil. Real Estate (-1.07 percent) shares outperformed. It was the benchmark index's third weekly drop out of four.
After the S&P 500 fell an overall 10.32 percent from the highest close of 2,930.75 registered on September 20, it rebounded, avoiding an official correction call. It finished the week 9.35 percent from its top.
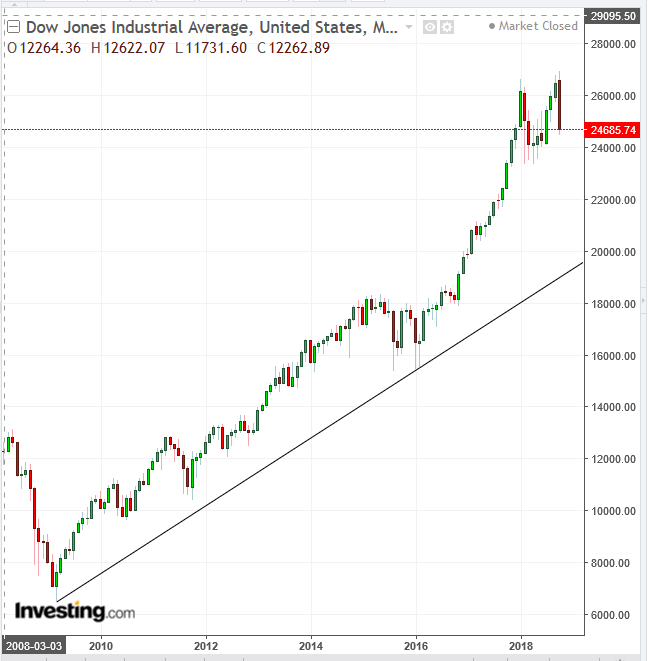
DJIA Monthly 2008-2018
The Dow Jones Industrial Average slipped 1.19 percent on Friday. The overall decline of 8.9 percent from its highest close on October 3 at 26,828.39, was trimmed slightly when the mega cap index rebounded, to finish at a 7.99 percent loss.
The 30 component index was the laggard on the way up; it’s now also the slowest of the US major indices to slide into correction mode. On a weekly basis, the index retreated 2.97 percent, falling for four out of the past five weeks.
As well, the Dow has yet to fall by a full 10 percent, and is therefore not yet considered by Wall Street to be in a correction. However, it has established a downtrend, in the midterm. Nevertheless, as is apparent in the monthly chart, it remains well above the uptrend line since the 2009 bottom and is nowhere near establishing two descending peaks and troughs, placing it very much still within a long-term uptrend.
In addition, with just a 0.14 percent decline since the beginning of the year, the Dow is also the second-best performing index on a year-to-date basis, after the NASDAQ Composite.
The NASDAQ plunged on Friday, down 2.07 percent, after Amazon and Alphabet shares sagged post earnings reports. While both tech giants beat expectations, their respective outlooks disappointed.
As we pointed out late last week, the current rout has been triggered primarily by softer guidance, and we questioned whether corporate executives are allowing negative sentiment to distract from solid macro and micro data. Even after the most recent tech rout, the sector remains the only one still in positive territory YTD, up 3.82 percent. On a weekly basis, though, the NASDAQ fell 3.78 percent for the fourth straight week with a combined 10.93 percent decline. It also shed 11.62 percent of value since its highest close on August 27, at 8,109.54. That puts it well within correction territory.
The Russell 2000 outperformed on Friday, down 1.07 percent, off 3.78 percent for the week—its sixth straight weekly loss totaling 13.82 percent. The small cap index fell into correction territory two and half week ago. It has slumped 14.76 percent from its August 27 top of 1,740.75, putting it into the deepest correction among its peers, underperforming for the year, down 3.38 percent year-to-date.
Overall, stocks rebounded somewhat on Friday after the US gross domestic product grew by 3.5 percent, annual rate, better than the 3.3 percent forecast. Also, consumer spending (which makes up more than 2/3 of GDP transactions) increased 4 percent, the strongest showing for this metric since the fourth quarter of 2014, overshadowing the less promising PCE price index (a key inflation measure) grew by 1.6 percent, missing expectations of 2.2 percent growth by a wide margin.
If earnings are still pretty strong, as we've pointed out, with growth of about 20 percent from the last year and economic data is mostly expanding, what could be triggering the recent selloffs? It appears the driver is sentiment—both by investors and perhaps by company executives—regarding the trade war and rising interesting rates.
Still, on Thursday we called a midterm downtrend for both the SPX and the Dow, as the price established two descending peaks and troughs on the daily chart, after it crossed below the uptrend line since the February bottom.
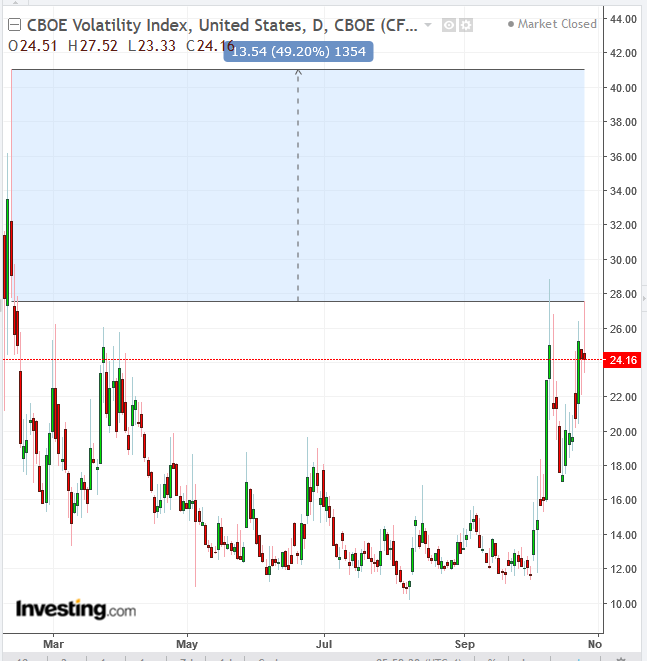
VIX Daily
Despite all the headlines, the VIX showed that volatility didn’t increase for the month and reached only half of the February spike, underscoring a lack of panic, despite the extent of the selloff.
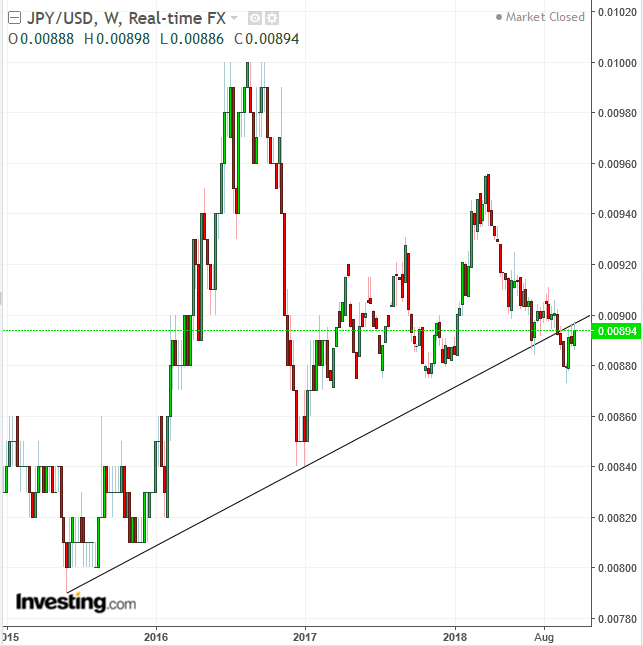
USDJPY Weekly
In FX markets, the yen remains below its uptrend line since May 2015, further confirming that lack of panic.
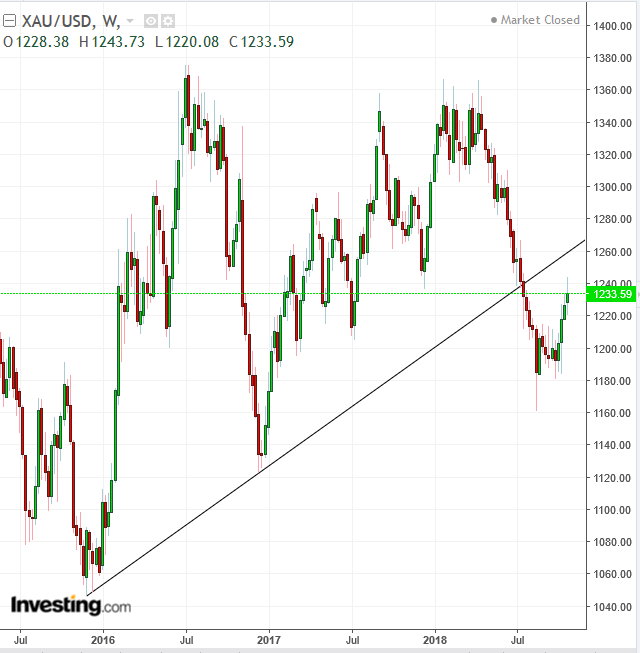
XAUUSD Weekly
Additionally, gold, which tracks the yen, also remains below its uptrend line since November 2015.
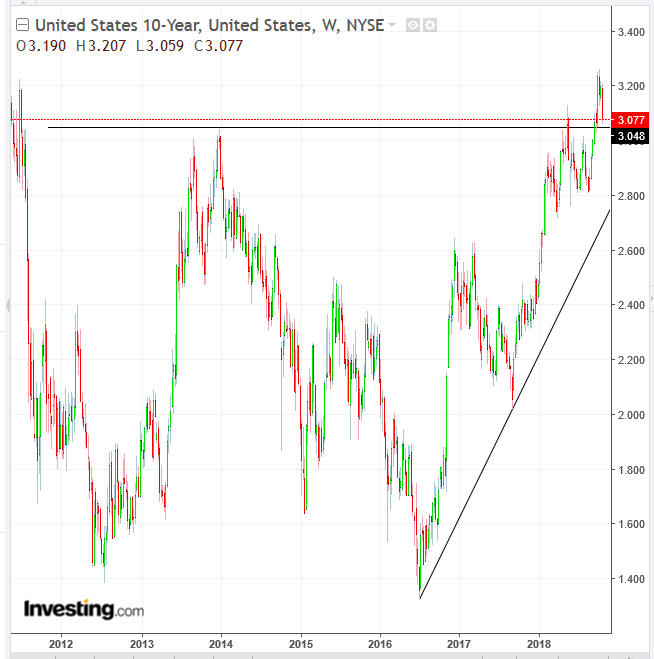
Treasurys demonstrate the same lack of alarm on the part of investors. Yields are still in an uptrend since mid-2016 and have in fact formed a massive double-bottom since 2011, whose neckline is providing a support above 3.000.
USDCNY Monthly
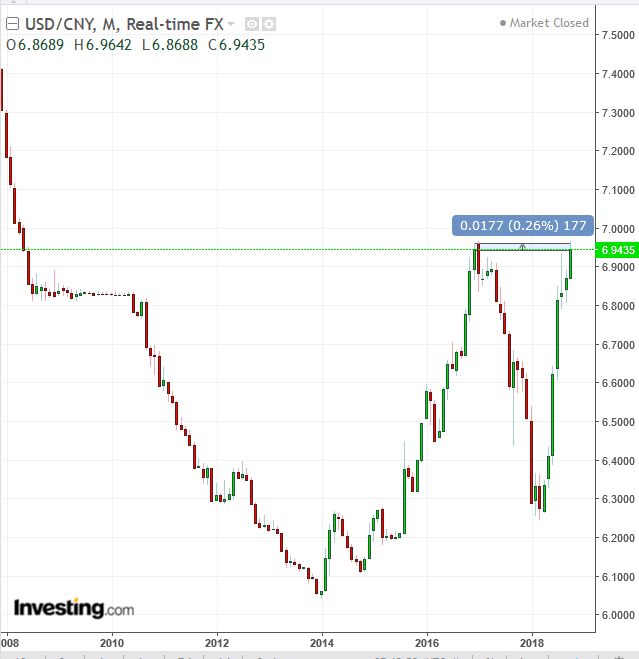
Still, we might expect further escalation of trade tensions between the world’s two largest economies, as the Chinese yuan is testing its lowest level since December 2016. A close that's just a quarter percent lower will take it to its lowest level since April 2008. That psychological level is likely to take the trade war to another level.
Then, again, this might be when the US and China realize that a game of chicken would cost both economies dearly. At that point they could backtrack to a compromise, in which both save face.
Oil Daily
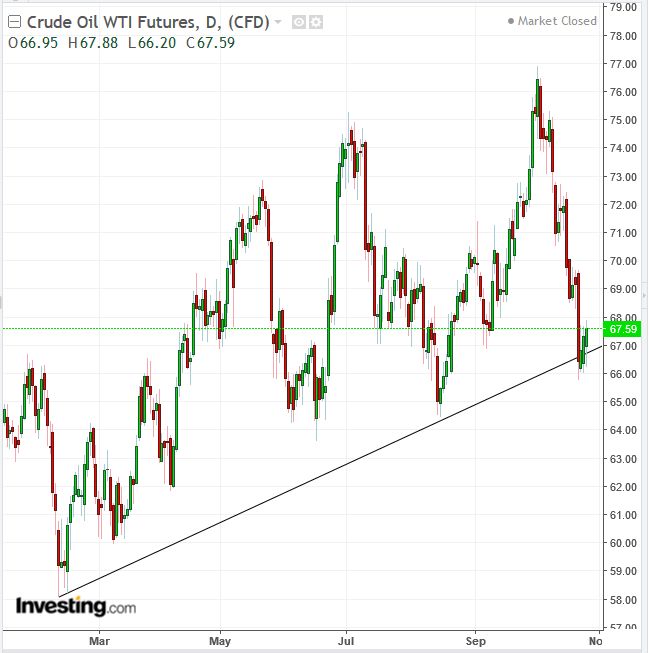
West Texas crude oil extended an advance after reaching the uptrend line since February, after falling both because of risk-off sentiment and the Saudi pledge to keep prices low by making up what’s missing from supply.
Add to My Watchlist
What is My Watchlist?
