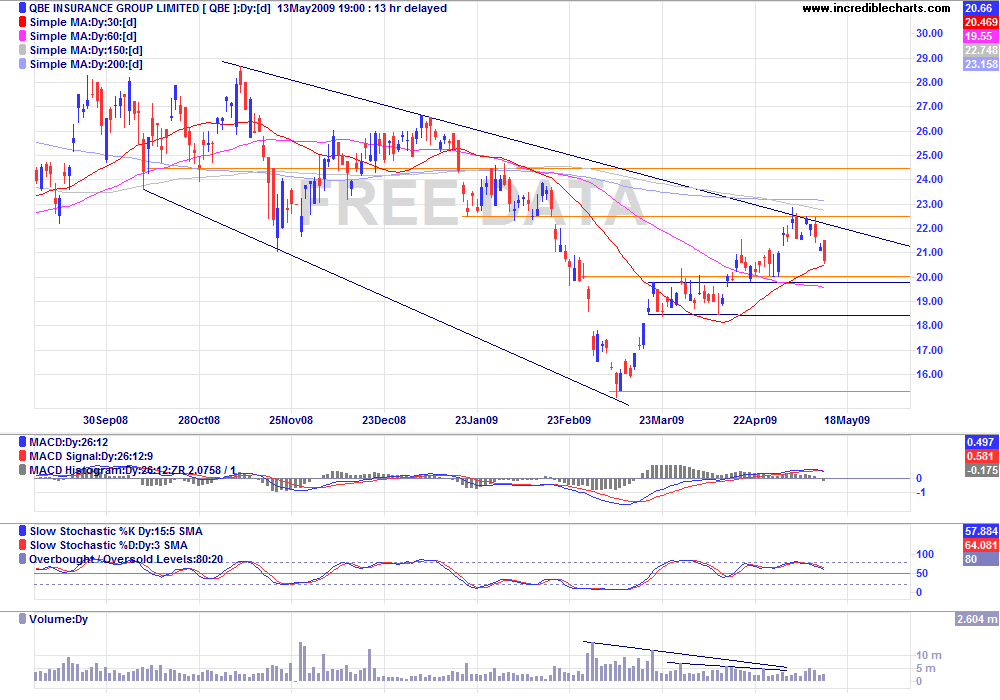
My version of the down channel but missing todays candle (delayed data).
I currently see support levels at $20.00, $19.75 and $18.50 before the $15 previous low.
$20 is a long term support line.
$19.75 is the upper resistance between Mar 19 and Apr 9, it also has become the support line post that date (15 apr, 21 apr and today).
$18.50 is the lower support between Mar 19 and Apr 9.
Above I see resistance at $22.50 and $24.50 as well as the down trend line currently around $22.
I would see a possible 10% upside from here to $22 hitting our down trend line but on the flip side you could be looking at a 25% downside to $15!
But as has been shown in other threads my reading of charts is still lacking so take all with a large grain of salt :P
- Forums
- ASX - By Stock
- short
My version of the down channel but missing todays candle...
-
- There are more pages in this discussion • 1 more message in this thread...
You’re viewing a single post only. To view the entire thread just sign in or Join Now (FREE)
Add QBE (ASX) to my watchlist
 (20min delay) (20min delay)
|
|||||
|
Last
$16.08 |
Change
0.150(0.94%) |
Mkt cap ! $24.15B | |||
| Open | High | Low | Value | Volume |
| $15.93 | $16.16 | $15.88 | $60.39M | 3.753M |
Buyers (Bids)
| No. | Vol. | Price($) |
|---|---|---|
| 1 | 3681 | $16.04 |
Sellers (Offers)
| Price($) | Vol. | No. |
|---|---|---|
| $16.09 | 18393 | 2 |
View Market Depth
| No. | Vol. | Price($) |
|---|---|---|
| 1 | 125 | 16.000 |
| 1 | 787 | 15.890 |
| 2 | 163 | 15.850 |
| 1 | 135 | 15.840 |
| 1 | 1200 | 15.820 |
| Price($) | Vol. | No. |
|---|---|---|
| 16.090 | 501 | 1 |
| 16.150 | 1586 | 2 |
| 16.190 | 1000 | 1 |
| 16.200 | 899 | 2 |
| 16.230 | 4000 | 1 |
| Last trade - 16.10pm 23/08/2024 (20 minute delay) ? |
| QBE (ASX) Chart |
The Watchlist
SER
STRATEGIC ENERGY RESOURCES LIMITED
David DeTata, Managing Director
David DeTata
Managing Director
SPONSORED BY The Market Online


