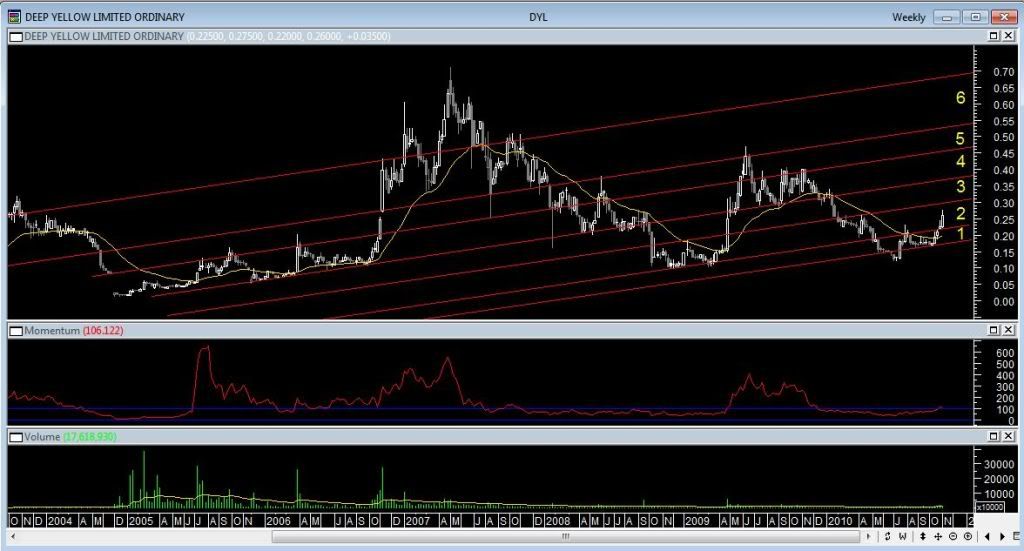
Many stocks that cleanly ebb and flow within the markets will move within parallel channels at an angle or rhythm unique to the stock, i.e. a signature angle. Once identified, trading the range within these parallel channels becomes a much easier process as:
1) For Entries - it fine tunes them by helping to buy at value near the bottom of a channel or support
2) For Exits - assists in evaluating the potential upside based on immediate or short term targets or resistance (top of channel currently in play) and stretch targets (top of subsequent channels) if stock has extra boogie in it
3) For Stops - when price breaches bottom of channel currently in play (i.e. support becomes resistance) one can look to exit using auto or mental stops as momentum has clearly waned.
4) Using the previous points above as part of an overall trading strategy this should assist in cutting under performers quickly, letting winners ride and generally improving the risk reward ratio of any trade much better.
In my opinion use of these channels provides an extra edge over more traditional horizontal lines of support and resistance (and I still use these too). This is because it adds the element of TIME to the analysis, i.e. not only what price a stock is likely to break or bounce off the bottom or top of a channel but WHEN it is likely to do this. Also as the element of TIME is introduced into the analysis this infers too that support and resistance changes too depending on how far time in the market is projected. I guess what I am saying too is that fixed price alerting, while still useful, does have its limitations.
Anyway, now with that bit of context out the road, I have marked out what I think are the signature parallel channels for DYL. In summary, DYL has established itself in the 2nd parallel channel in the last 2 weeks. Last week was an ideal time to enter as it was near the bottom of the channel if the plan is to trade the range of this 2nd channel. For potential targets the top of the 2nd channel represents a good opportunity to take some green stuff off the table. Alternatively if one has a longer time frame or if DYL has much more gas in the tank then looking for DYL to secure position in 3rd, 4th or 5th channels would be objectives of stretch targets. As for the downside, obviously if DYL falls back into the 1st parallel channel then current uptrend will be over for the time being. It will then be a waiting game or maybe just exit to look into other opportunities.
Of course this is my opinion only and please DYOR!
- Forums
- ASX - By Stock
- signature parallel channels revealed
Many stocks that cleanly ebb and flow within the markets will...
Featured News
Add DYL (ASX) to my watchlist
 (20min delay) (20min delay)
|
|||||
|
Last
96.3¢ |
Change
-0.033(3.27%) |
Mkt cap ! $950.0M | |||
| Open | High | Low | Value | Volume |
| 98.5¢ | 99.5¢ | 96.0¢ | $1.175M | 1.206M |
Buyers (Bids)
| No. | Vol. | Price($) |
|---|---|---|
| 22 | 138974 | 96.0¢ |
Sellers (Offers)
| Price($) | Vol. | No. |
|---|---|---|
| 96.5¢ | 106917 | 15 |
View Market Depth
| No. | Vol. | Price($) |
|---|---|---|
| 22 | 138974 | 0.960 |
| 17 | 143788 | 0.955 |
| 41 | 340011 | 0.950 |
| 11 | 71108 | 0.945 |
| 12 | 113814 | 0.940 |
| Price($) | Vol. | No. |
|---|---|---|
| 0.965 | 106917 | 15 |
| 0.970 | 176612 | 25 |
| 0.975 | 76501 | 15 |
| 0.980 | 208446 | 12 |
| 0.985 | 126717 | 6 |
| Last trade - 11.54am 06/09/2024 (20 minute delay) ? |
Featured News
| DYL (ASX) Chart |


