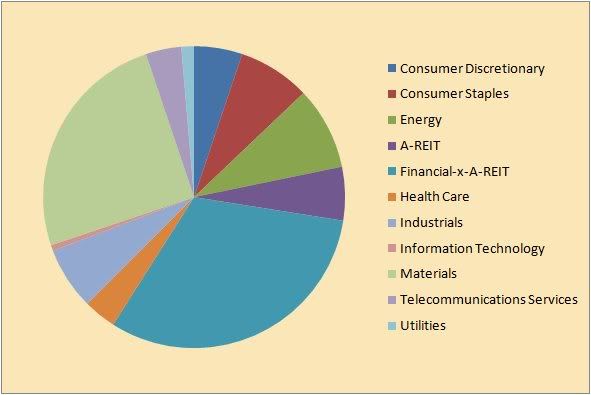
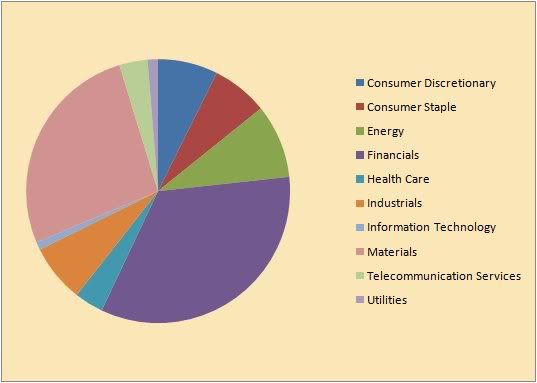
The answer is in the divergences of the subsectors - mainly financials and industrials. US has the same thing going on with XLF and XLI, only the market caps must be weighted differently within US DOW and SPX.
Here XJO by market cap of total XJO (200 counted)
Here's the ASX - my collection of tradables (1715 in no.)
$6.6Bn wiped of the ASX today - similar amount ($6.7Bn) wiped out of financials alone. Divergences in the sectors is what's going on - amounting to XJO tracking skewed to DOW and SPX. Now you need to watch the subsector perfomances if you are betting our indexes.
Nett result might be short term divergence, or weaker trend correlation which is what is being observed by the looks. This is where our slope of growth might change in the short term pending on how much pressure on the financials.
rgds,
pw
- Forums
- ASX - By Stock
- snippets 13/11/09
The answer is in the divergences of the subsectors - mainly...
-
-
- There are more pages in this discussion • 1 more message in this thread...
You’re viewing a single post only. To view the entire thread just sign in or Join Now (FREE)
Featured News
Add XJO (ASX) to my watchlist
 (20min delay) (20min delay)
|
|||||
|
Last
8,295.1 |
Change
68.800(0.84%) |
Mkt cap ! n/a | |||
| Open | High | Low |
| 8,226.3 | 8,319.4 | 8,226.3 |
Featured News
| XJO (ASX) Chart |
The Watchlist
EQN
EQUINOX RESOURCES LIMITED.
Zac Komur, MD & CEO
Zac Komur
MD & CEO
SPONSORED BY The Market Online


