Redbacka, I'm with you. I'm seeing the correction stalling and moving sideways to up.
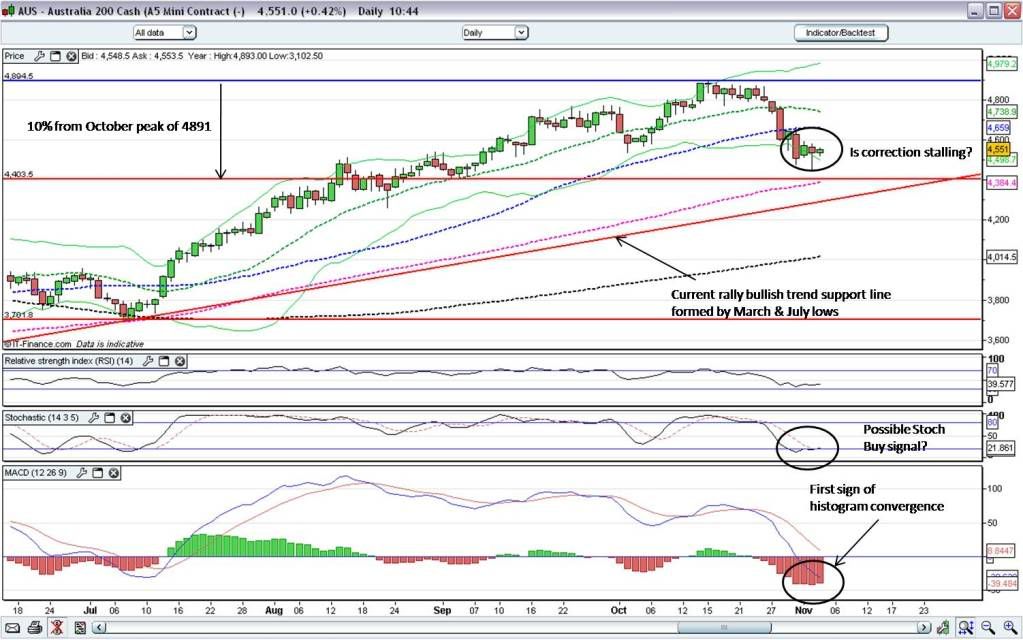
Following is the XJO daily showing the index has stopped short of falling 10% from its recent peak, and appears to be stalling. Its still well above the bullish trend support line formed by the rally's March & July lows, and the MACD and Stoch are showing some possible turn signals, yet to be confirmed:
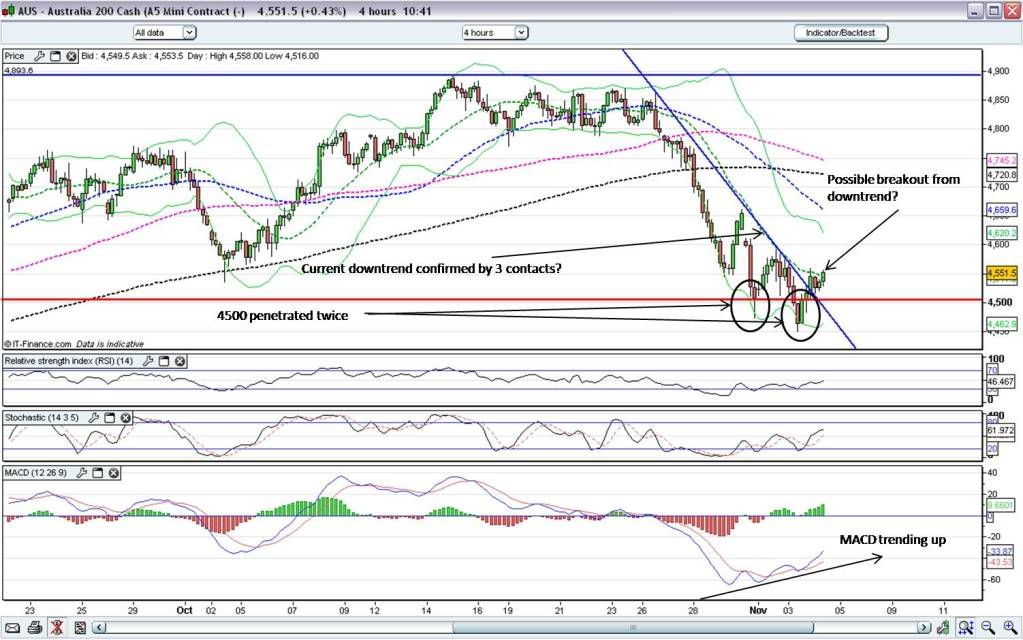
If we have a look at the 4 hour chart we can see the successive lower swing lows, with two penetrations of 4500, but today's sideways movement indicates a possible 1st wave up, yet to be completed:
With futures on the Dow looking green atm, if that materialises into a positive night then we could see the XJO confirming the breakout of that downtrend, and I'd be looking for the completion of a higher swing low. Personally I expect a positive Fed statement tonight (cant imagine them making a negative one!) will kick the US index up tonight.
We may still see volatility and some sideways momentum, but atm its not looking like going lower to me. Hope I'm right. Cheers, Sharks.
- Forums
- ASX - By Stock
- snippets - 30/10/09
Redbacka, I'm with you. I'm seeing the correction stalling and...
-
- There are more pages in this discussion • 25 more messages in this thread...
You’re viewing a single post only. To view the entire thread just sign in or Join Now (FREE)
Featured News
Add XJO (ASX) to my watchlist
 (20min delay) (20min delay)
|
|||||
|
Last
7,767.5 |
Change
7.900(0.10%) |
Mkt cap ! n/a | |||
| Open | High | Low |
| 7,759.6 | 7,819.0 | 7,754.9 |
Featured News
| XJO (ASX) Chart |
The Watchlist
LU7
LITHIUM UNIVERSE LIMITED
Alex Hanly, CEO
Alex Hanly
CEO
SPONSORED BY The Market Online


