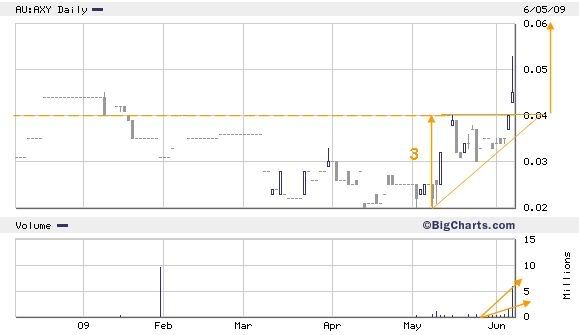
Ok here's the same charts but with todays action included. I'm not sure what is surprising me more, the volume gone through on AXY today, or the fact that I *may* actually have got one right for a change..
The six monthly chart above, shows the spike up to 5.3c, and the huge volume from that one single cross-trade of 5million. I got the volume arrow horribly wrong (in a good way!).
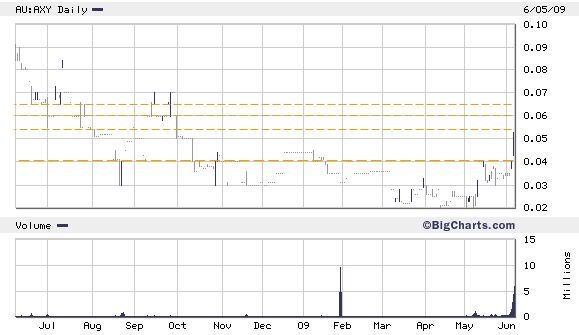
Why did it stop at 5.3 - see the next chart. The only concern I can see is the shooting star candle that is often a reversal indicator. If the price drops next week, I would expect it to drop back down to 4c, but hopefully 4c is now a support line rather than resistance, for a bounce. If it keeps going up - again see the next chart:
The one year chart shows where there are signs of resistance on its way up, the first being 5.3c that it touched today. the next is at 6c and 6.5c. But if the volume grows and keeps growing these shouldn't be much of a hurdle. The next one up is 8c, but I think we're going to need a HUGE increase in volume, or some outstandingly(*) good news to get up there soon.
Anything beyond that will need a memory older than 12months, and it sounds like there's a few of them around with AXY!
(*) Is oustandingly even a real word?
- Forums
- ASX - By Stock
- AXY
- some charts for axy
some charts for axy, page-5
-
-
- There are more pages in this discussion • 16 more messages in this thread...
You’re viewing a single post only. To view the entire thread just sign in or Join Now (FREE)


