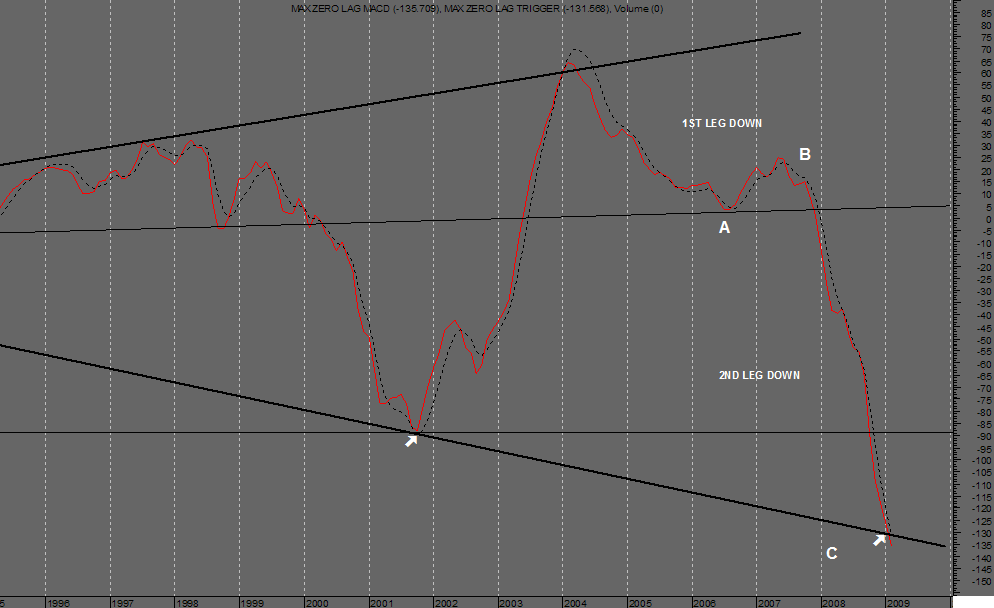
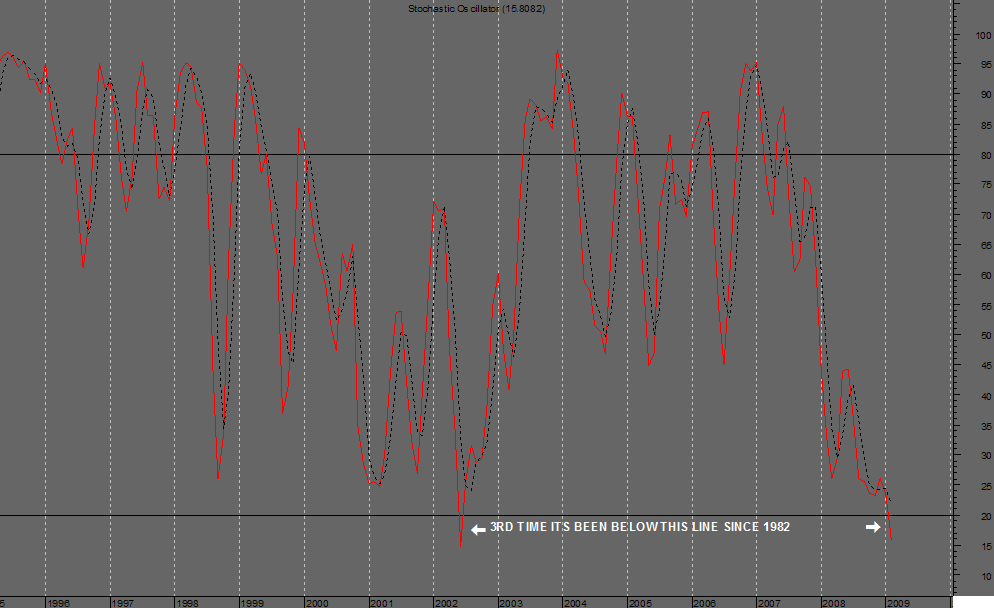
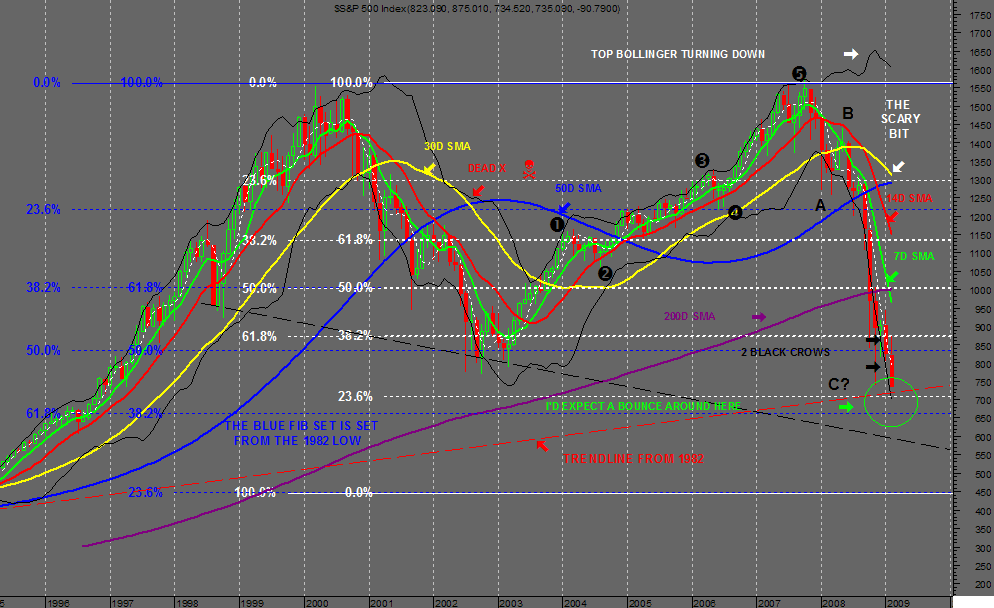
Here's some ideas on whats in the pot some have been talking about a final capitulation low well in my book thats been happerning since the "B" on the chart and we are some where near a bottom.
We just missed the chance of a Double Bottom lets hope for the next lot of fibs and the trenline to kick in if not ITS BACK TO 1995 LEVELS.
The Scary bit is the 50d & 30d MA's are about to cross all Inds are oversold.
This has been a Faster steeper plunge than 2001/2003 so I'd be hoping for a faster recovery.
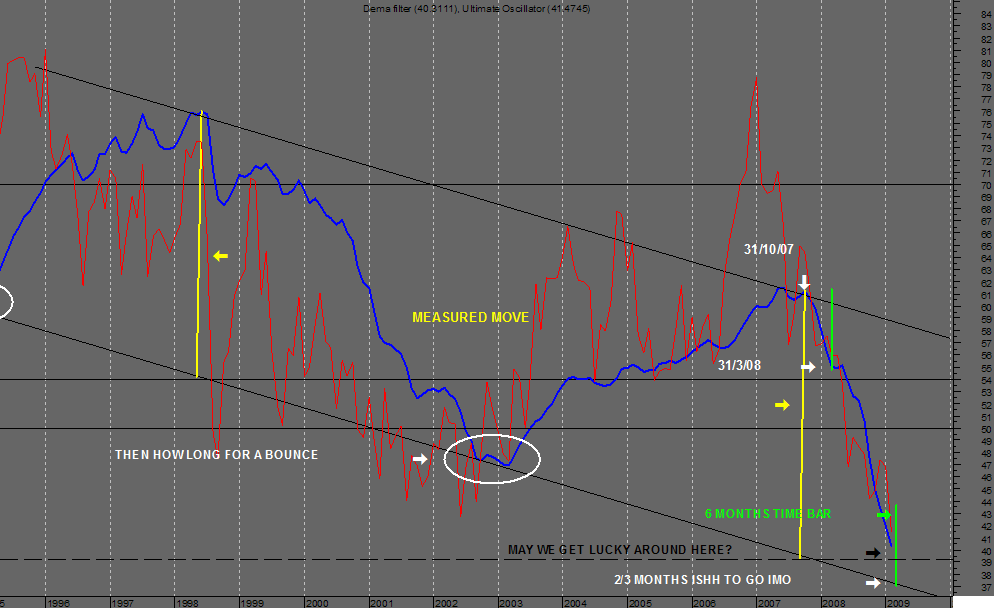
The green time line on the Dema Filter is just rough way to get a idea of time.
I've made the Inds Fullsize so you get the idea of what I'm seeing there are 2 fib sets one covers the Bull from 1982 the other from 1995 at this point they are close 700/650 for important levels on both.imo
At this point we have a A&B we just want to know where the Hell is "C"...LOL
I've been wrong on this one before too by the way..
Cheers Pete


- Forums
- ASX - By Stock
- DJIA
- sp 500 chart
DJIA
dow jones industrials
Add to My Watchlist
0.31%
 !
26,683
sp 500 chart
Featured News
Add to My Watchlist
What is My Watchlist?
A personalised tool to help users track selected stocks. Delivering real-time notifications on price updates, announcements, and performance stats on each to help make informed investment decisions.
 (20min delay) (20min delay)
|
|||||
|
Last
26,683 |
Change
82.730(0.31%) |
Mkt cap ! n/a | |||
| Open | High | Low |
| 26,683 | 0.00 | 0.00 |


