fair enough
but i was actually hoping to see a chart...
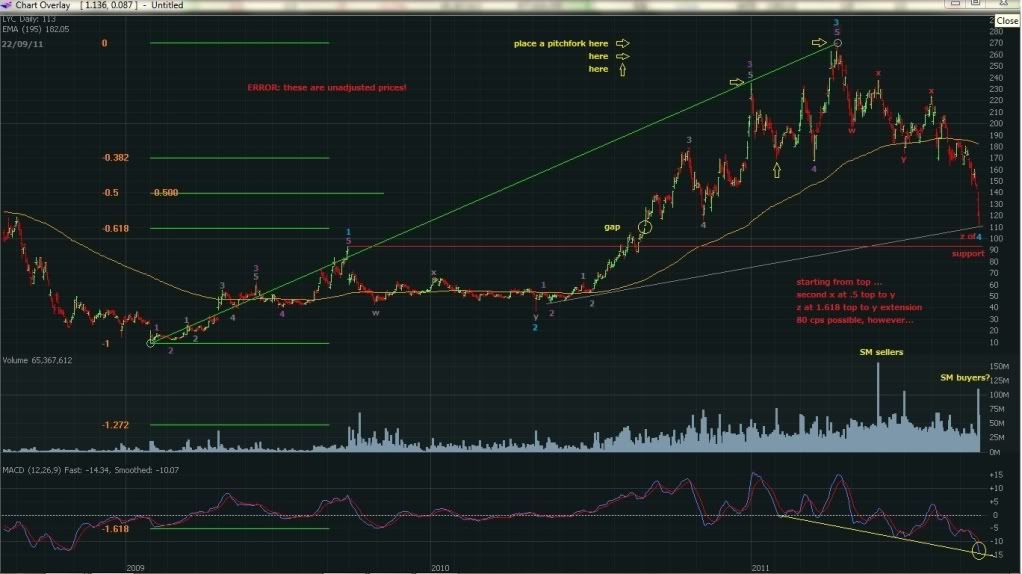
in that sense, mine is in gross error
only just realised it, too
been pouring over what the heck price was doing inside 93cps, basis 23/09/11, and the answer is here
"adjusted prices"
they're to do with rights issues
always get me, always always and again today
cut my losses, will have another look tomorrow
sorry to pee on your chips, grudgy
be a good sport and throw us a bone mate
was a bit narky of me, shags
still interested in seeing what you see
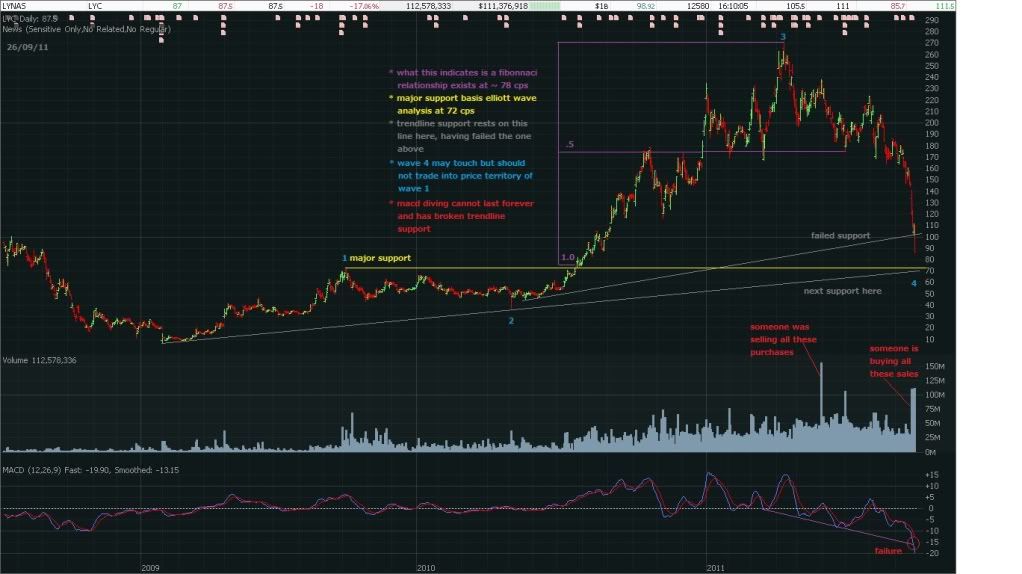
anyway, here are the adjusted and unadjusted prices
unadjusted
adjusted
one possible way to trade is basis ta to back up the fundamental analysis
to each their own, but a system does help...
with adjusted prices, i'm looking for anything resembling a trend change at or near current prices
it appears that may be what's happened at the close today with the very large closing volume and intra-day macd divergence
can it trade lower?
of course, but by way of ew analysis on adjusted prices, a scourge that they are, the next place for a stop loss might reasonably be under 72 cps basis the concept of wave 4 not trading into the price territory of wave 1 which on the adjusted chart is at 72 cps
IF PRICE TRADES BELOW 72 cps then something else's going on
what could that be?
the count for three waves up to 270 is clearly wrong, which happens, and as uncomfortable as it may be, the default view has to be entertained
what that proposes is that there have been a completed five waves up, not three, and that price can come all the way down to the base of the five up.....
so for my money, which it is, 72 cps must hold
if it doesn't then the gap at the end of april 2009 is fair game
how to trade this?
not allowed to say, but i'm pretty clear about one thing
it is that fair dinkum technical analysis on how-to-trade based on solid technical analysis (which is often wrong and must be accounted for in a trading plan) remains sadly lacking in many threads
so give over, grudgy
enough of the fair talk
lend a hand, sir
- Forums
- ASX - By Stock
- sp calamity waiting to happen
fair enoughbut i was actually hoping to see a chart...in that...
-
- There are more pages in this discussion • 2 more messages in this thread...
You’re viewing a single post only. To view the entire thread just sign in or Join Now (FREE)
Featured News
Add LYC (ASX) to my watchlist
 (20min delay) (20min delay)
|
|||||
|
Last
$6.06 |
Change
-0.005(0.08%) |
Mkt cap ! $5.655B | |||
| Open | High | Low | Value | Volume |
| $6.00 | $6.08 | $5.97 | $4.752M | 788.1K |
Buyers (Bids)
| No. | Vol. | Price($) |
|---|---|---|
| 17 | 8648 | $6.05 |
Sellers (Offers)
| Price($) | Vol. | No. |
|---|---|---|
| $6.06 | 7776 | 25 |
View Market Depth
| No. | Vol. | Price($) |
|---|---|---|
| 17 | 9239 | 6.050 |
| 23 | 21148 | 6.040 |
| 21 | 31827 | 6.030 |
| 16 | 50202 | 6.020 |
| 14 | 15621 | 6.010 |
| Price($) | Vol. | No. |
|---|---|---|
| 6.060 | 5301 | 20 |
| 6.070 | 25781 | 22 |
| 6.080 | 37300 | 17 |
| 6.090 | 45177 | 14 |
| 6.100 | 25801 | 16 |
| Last trade - 11.11am 25/07/2024 (20 minute delay) ? |
Featured News
| LYC (ASX) Chart |
The Watchlist
FHE
FRONTIER ENERGY LIMITED
Adam Kiley, CEO
Adam Kiley
CEO
Previous Video
Next Video
SPONSORED BY The Market Online


