Jako: Let me be the first today to give you the Big Tick. Always good stuff.
XJO up +0.83% which follows up from the big move on Friday when the XJO was up +1.51%
Here's the chart:
I'm trialling a new visualisation process (technical analysis is all about visualisation despite the jargon and the maths).
I'm employing the following methods on the index chart:
1. A band of MAs - 34 EMAs based on the High/Low/Close figures - giving a band of three MAs.
2. The Super Trend Line (10/3) - that's the Gold/Blue line which moves in up/down moves and then plateaus.
2. Horizontal support resistance levels.
The lower panes are the usual technical analysis tools I use. They haven't changed. But these require some experience in interpretation
Looking at this chart - as I've constructed it - it doesn't take much of a genius to see that the XJO is in a sideways consolidation. It remains above the support levels for a bullish configuration.
Looking at the chart with my adaptations - Horizontal Support and the 3-Bands of Moving Averages.
We've had two strong days to the upside. A clear upside break of resistance and if the CCI gets above 100 - we'll be cooking with gas. Hopefully.
Here are a few other charts:
BHP
Using my visualisation process - BHP has now clearly moved into a medium term up trend. It has broken above the EMA Band plus the Super Trend Line has been broken to the upside.
Indicators are getting stretched to the upside - that's not unusual in a strong up trend.
I think the first serious test will occur about the recent high at 34.12. That's the high which occurred in early March. If we see the TSI turn down around that level - it might be time t take profits.
CBA
Using this visualisation method, we can see, obviously, that CBA has been in a strong up trend since October 14 when it also broke out from a double bottom pattern.
Currently, CBA might be in some danger. STL has turned bearish, and the candlestick chart is below the three MA bands on the chart. But - indicators have turned up, especially TSL.
It needs to get above the three MA band to prove itself - but looking positive at this stage.
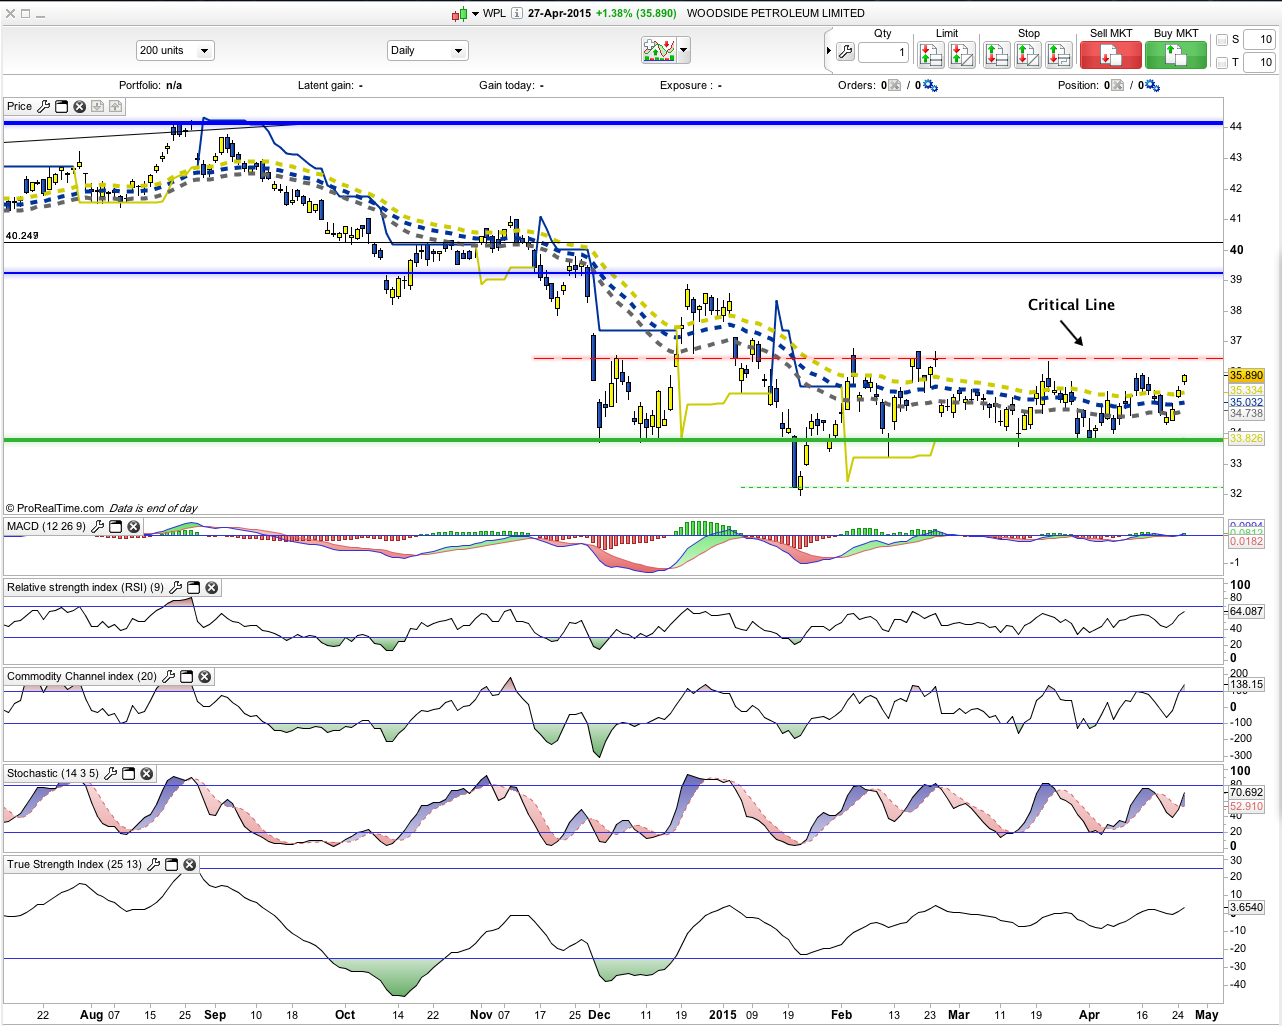
WPL
Clearly, WPL is in a sideways consolidation, but it has a bullish bias. It is well above the low of late Jan.15, but still hasn't been able to break out to establish a new fractal high. New Highs on the chart are continuing to cascade lower although today's intra-day New High at 35.93 came close to moving above the intra-day high of 35.97 on 15 Apr.15.
TLS
TSL is looking very promising. It's been one of the best performing stocks on the ASX. Since early Feb.15, it's been showing weakness. But may be overcoming that at this stage.
It needs to prove itself with a break higher above horizontal resistance and the STL.


 (20min delay)