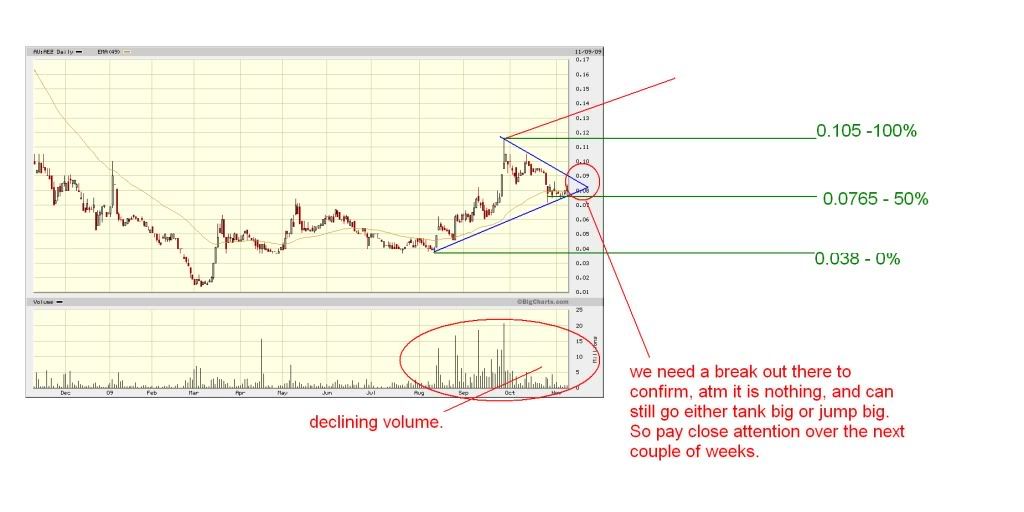
Please visit this site.
http://stockcharts.com/school/doku.php?id=chart_school:chart_analysis:chart_patterns:symmetrical_triangle
___________________________________________________________
I think we are close to an implusive move. And I believe it is a positive one, as I have a few indicators and they are all lighting up
Williams %R is above -50
slow stochastic
RSI is at 50 again.
The chart that I have done is showing that we are now at a critical stage. If we have a break out (up) over the next two weeks, then this should send us over 14c or thereabouts. Everything I have said here are all based on my humble T/A view and contain zero fundamental value. DO NOT FOLLOW ME.
"
I have provided a link to explain Symmetrical Triangle, so if AEZ indeed forms one, and the break out is UP, you all know what to do.
I will keep you all AEZ people inform as soon as I see "Somthing special"
Regards
Sunny Liu
Add to My Watchlist
What is My Watchlist?


