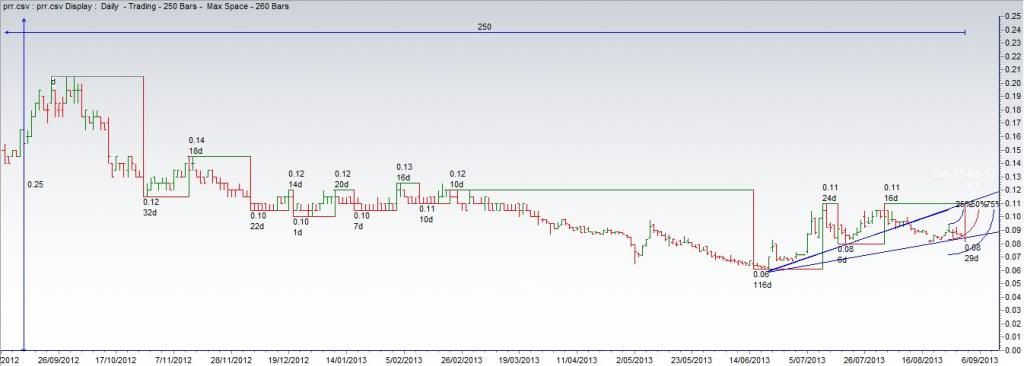
Well Vulture I’m in need of a ton of guidance and understanding because I think that your glad bag bucket of over specified indicators doesn’t really provide any insight to much at all. Its all T and no A. And not even a chart.
I agree with Robhood - anyone who reports a RSI to two decimal places is reporting nonsense.
And apparently you claim to be “just relaying the present circumstance of the chart” in between calling people knuckle heads while giving a Laurel and Hardy impersonation with Funky getting the wrong end of the stick with each others posts.
You think theres a down-trend because of trend channels which have been shown to have low predictive power. But your nose – and Boilers and Funkys - tells you there a trade in here somewhere but then your hotpotch of indicators with no theory gives you no method.
So why the interest from the TA exponents on a spec like PRR?
Fear and greed. Positivism begets more positivism and pessimism more pessimism. These trends build and feed off each other. In PRR’s case its been pretty gloomy getting gloomier.
Why – fundamentals. In PRR’s case interim data. And Provenge hasn’t helped I don’t think. A complicated, expensive therapy showing marginal benefit. Worse still it provided a glaring example that even when you get approval rivers of gold don’t necessarily flow. Difficult problems with manufacturing and getting reimbursements to change clinician behaviour also have to be tackled.
So pretty gloomy hence the attraction to TA types. A sp that has had been hammered (overdone) can turn nicely. Being at the first bus stop of the turn is very important in a spec (where trends can be very short lived – or simply pumps and dumps). Its where there is maximum value in a trade.
Interestingly it is where true momentum and trend traders don’t trade. You guys are the one and eight eighths kind of guys as Jesse Livermore coined. Trying to trade right at the bottom - in other words try to “thin the herd” - spot the trend reversal before anyone else. Which is exactly where professional trend traders don’t trade – because they don’t trade specs on TA.
What I think the purported TA “trend followers” do here is try and catch swings – without very much swing analysis. While boring everyone to death with the infernal “down trend” idea.
Now Robhood – one day my friend you should study a bit Gann. Because its got an interesting story to tell about the problem of charts only showing the past. Theres a lot of complicated theory but by squaring price and time on a chart (45 degrees - 1:1 for price and time) the idea is that the past, present and future all sit on a Gann angle.
So on the chart we have two Gann angles. The first - the 1:1 angle which provides major support and reflects a sustainable, perfectly balanced trend, not too fast and not too slow, but just right.
The price fell off that angle (the trend weakened) – and so as the theory predicts the sp moved towards the next Gann angle (18.75 degrees - 1:2). We would expect prices to consolidate at this next angle. Which is exactly what they have has done.
The little glimpse into future here from the angles is that unlike a trend line which requires two points to draw – the Gann angle could be drawn as at the 17/6/2013 on the swing low. Overlay this with Gann 4-bar swing chart as our main trend indicator (measuring swings only after the market has made 4 consecutive higher-highs or 4 consecutive lower-lows) and we can see we are in the swing down from the fall off the perch from the 1:1 angle..
Where to from here. Well the conservative hop off the bus on the break off a 1:1 angle. 1:2 offers less strength of support. The Fib arc shows the sp sitting right on 50% retracement. I’ve seen sillier trades than buying on a 1:2 upward Gann angle on a 50% fib retracement. Next week will be interesting - but then every week is interesting isn't it.
GLTH Southoz
[URL=http://s1246.photobucket.com/user/Southozly/media/prr_zps7d4ef3ab.jpg.html][/URL]
- Forums
- ASX - By Stock
- IMM
- ta observations
ta observations, page-43
-
- There are more pages in this discussion • 11 more messages in this thread...
This thread is closed.
You may not reply to this discussion at this time.
You’re viewing a single post only. To view the entire thread just sign in or Join Now (FREE)
Featured News
Add IMM (ASX) to my watchlist
 (20min delay) (20min delay)
|
|||||
|
Last
32.0¢ |
Change
0.015(4.92%) |
Mkt cap ! $464.8M | |||
| Open | High | Low | Value | Volume |
| 30.0¢ | 32.5¢ | 30.0¢ | $1.168M | 3.702M |
Buyers (Bids)
| No. | Vol. | Price($) |
|---|---|---|
| 5 | 148547 | 32.0¢ |
Sellers (Offers)
| Price($) | Vol. | No. |
|---|---|---|
| 32.5¢ | 51809 | 2 |
View Market Depth
| No. | Vol. | Price($) |
|---|---|---|
| 5 | 148547 | 0.320 |
| 3 | 107807 | 0.315 |
| 2 | 38192 | 0.310 |
| 2 | 58192 | 0.305 |
| 10 | 490669 | 0.300 |
| Price($) | Vol. | No. |
|---|---|---|
| 0.325 | 44309 | 1 |
| 0.330 | 179497 | 6 |
| 0.335 | 82304 | 5 |
| 0.340 | 49303 | 3 |
| 0.345 | 27527 | 3 |
| Last trade - 16.10pm 24/07/2024 (20 minute delay) ? |
Featured News
| IMM (ASX) Chart |
The Watchlist
1CG
ONE CLICK GROUP LIMITED
Mark Waller, MD
Mark Waller
MD
Previous Video
Next Video
SPONSORED BY The Market Online


