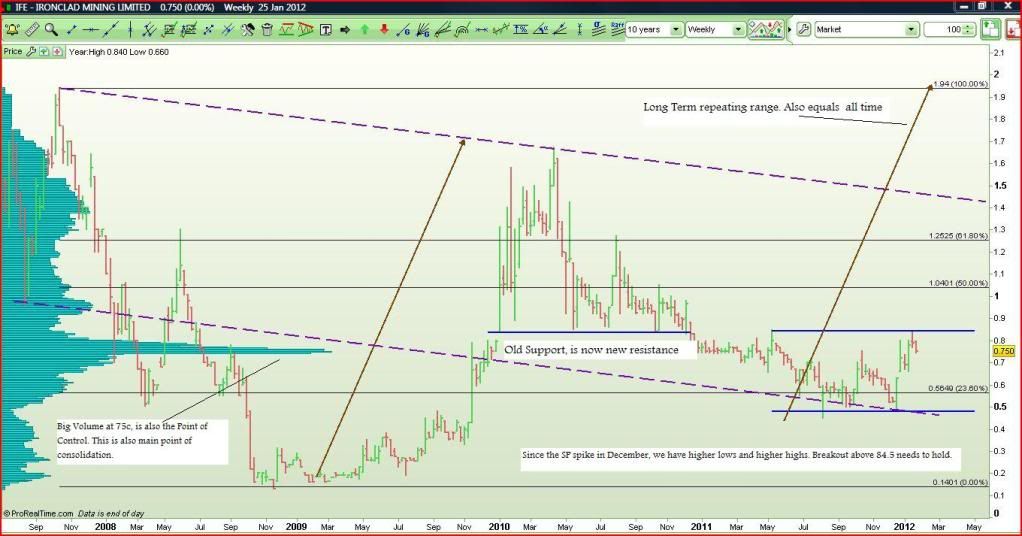
This is the weekly chart which I have had an eye on for a few months.
I think the long term range will top out at $2, how fast it gets there remains to be seen. You can see from the chart that the last major spike up left a few gaps behind, I think this will happen again and doubt we will get the one at 65 ish filled.
Big resistance at 84.5 which was also old support. That's the first hurdle, after that it might go.
Higher swing highs and high swing lows are playing out at the moment, which is giving the price action lots of time to form.
Hope this helps.
- Forums
- ASX - By Stock
- TYX
- ta
ta, page-2
-
- There are more pages in this discussion • 13 more messages in this thread...
You’re viewing a single post only. To view the entire thread just sign in or Join Now (FREE)
Featured News
Add TYX (ASX) to my watchlist
(20min delay)
|
|||||
Last
0.4¢ |
Change
0.000(0.00%) |
Mkt cap ! $13.15M |
Open | High | Low | Value | Volume |
0.4¢ | 0.4¢ | 0.4¢ | $370 | 92.40K |
Buyers (Bids)
No. | Vol. | Price($) |
---|---|---|
2 | 282599 | 0.4¢ |
Sellers (Offers)
Price($) | Vol. | No. |
---|---|---|
0.5¢ | 17747851 | 30 |
View Market Depth
No. | Vol. | Price($) |
---|---|---|
2 | 282599 | 0.004 |
13 | 10114101 | 0.003 |
9 | 7088897 | 0.002 |
8 | 17588888 | 0.001 |
0 | 0 | 0.000 |
Price($) | Vol. | No. |
---|---|---|
0.005 | 17747851 | 30 |
0.006 | 4390000 | 6 |
0.007 | 483500 | 2 |
0.008 | 1372154 | 5 |
0.009 | 18962 | 1 |
Last trade - 10.40am 11/10/2024 (20 minute delay) ? |
Featured News
TYX (ASX) Chart |