Here is the Coppock indicator from the last 28 yrs on the XAO. (sorry the graph is a bit faded, not sure what happened)
"A bull market is signaled when the Coppock Indicator turns up from below zero."
http://www.incrediblecharts.com/technical/coppock_indicator.php
"The indicator is trend-following, and based on averages, so by its nature it doesn't pick a market bottom, but rather shows when a rally has become established."
http://en.wikipedia.org/wiki/Coppock_curve
So for people not wanting to pick the bottom, but are waiting till the market enters its next bull stage (might be a while though!) this could be one to look out for.
I added in the green and red lines to signify the 0 crossover on the coppock Indicator. Although it is not suppose to generate sell signals, I added lines just to show how if you bought when it turned from negative to positive, and sold when it went back below zero, the last 5 out of 6 signals would have provided profits. That being said, all of the buy signals would have had an opportunity to sell for a profit at some time before it crossed below zero anyway.
What does everyone else think of this indicator?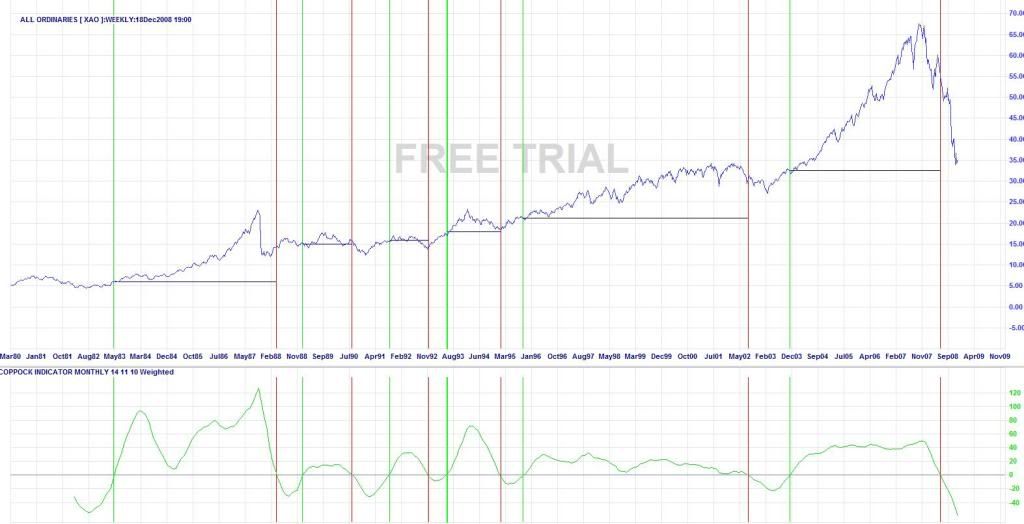
coppock indicator


Add XJO (ASX) to my watchlist
 (20min delay) (20min delay)
|
|||||
|
Last
7,724.3 |
Change
-25.400(0.33%) |
Mkt cap ! n/a | |||
| Open | High | Low |
| 7,749.7 | 7,751.8 | 7,718.0 |
| XJO (ASX) Chart |