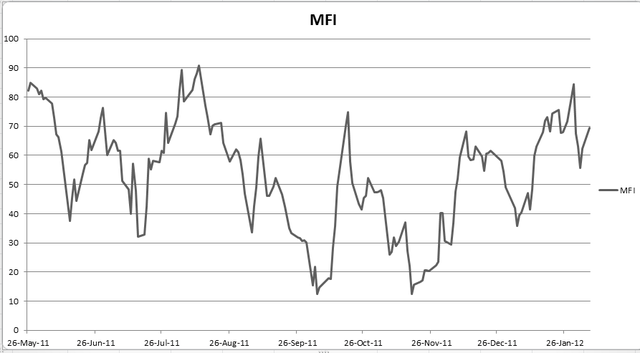
they suppose to be the same but dunno why the bigcharts one looks different.
here is the one I plot myself using excel![]()
- Forums
- ASX - By Stock
- LCY
- technical update
LCY
legacy iron ore limited
Add to My Watchlist
10.0%
!
0.9¢

technical update, page-7
Featured News
Add to My Watchlist
What is My Watchlist?
A personalised tool to help users track selected stocks. Delivering real-time notifications on price updates, announcements, and performance stats on each to help make informed investment decisions.
|
|||||
Last
0.9¢ |
Change
-0.001(10.0%) |
Mkt cap ! $97.62M |
Open | High | Low | Value | Volume |
0.9¢ | 0.9¢ | 0.9¢ | $257 | 28.6K |
Buyers (Bids)
No. | Vol. | Price($) |
---|---|---|
3 | 542871 | 0.9¢ |
Sellers (Offers)
Price($) | Vol. | No. |
---|---|---|
1.0¢ | 590716 | 6 |
View Market Depth
No. | Vol. | Price($) |
---|---|---|
3 | 542871 | 0.009 |
9 | 2173181 | 0.008 |
7 | 2765287 | 0.007 |
2 | 266831 | 0.006 |
1 | 333663 | 0.003 |
Price($) | Vol. | No. |
---|---|---|
0.010 | 590716 | 6 |
0.011 | 1985159 | 8 |
0.012 | 153172 | 2 |
0.013 | 100000 | 1 |
0.015 | 555555 | 1 |
Last trade - 12.02pm 30/07/2025 (20 minute delay) ? |
Featured News
LCY (ASX) Chart |