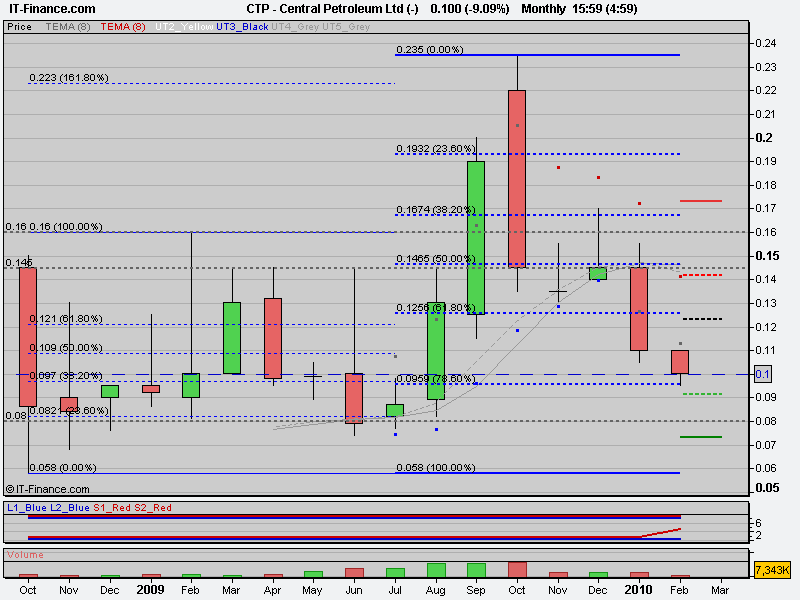
CTP MLY Chart:
1. A study of the Monthly Chart reveals the significance of the various Fibonacci Levels?
[Blue dotted Fib. Levels]
2. The 50% Level is clearly defined by Open and Close Candlesticks and the AUG. '08 ~High?
3. The 78.6% Fib. Retracement from the 23.5c high / 5.8c Low has been tested?
Technically, this can be a very strong Basing Support Level?
[I would expect a Basing Pattern to form at this Level.
The Base would probably take 15 to 45 trading days to form.]
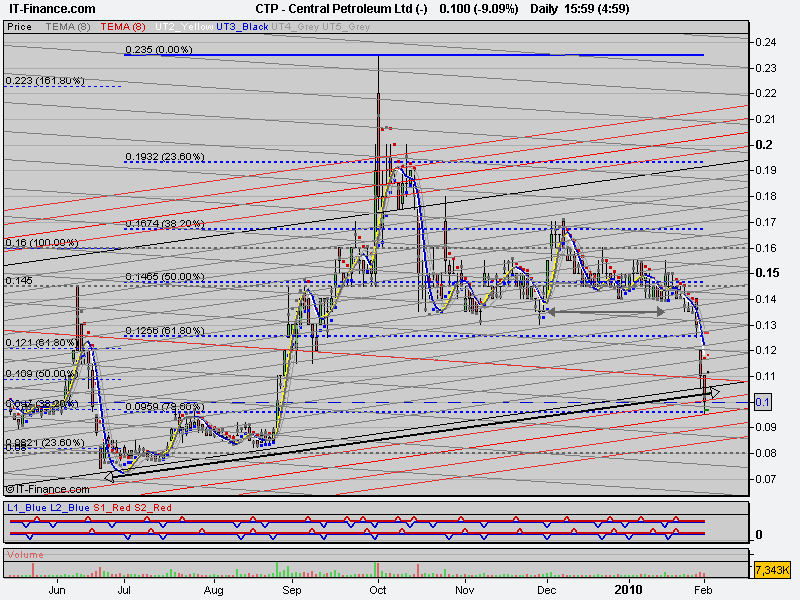
CTP DLY Chart:
1. Indicates 'Oversold' in the Uptrending Channel?
2. At or below 10c would be a very good buying level?
[Exact Fib. 78.6% Level is 9.59c]
The DLY Sell Off Volume has been far less than previous 'Dumps'?
[see JUN. and OCT. '09 Daily Dumps of almost 40M]
3. Note the JUL / SEP '09 Basing Pattern
[43 Days].
[I will wait till the Basing Pattern forms, and perhaps buy some more.]
Cheers,
U2


- Forums
- ASX - By Stock
- CTP
- technically, that's the bottom?
technically, that's the bottom?
-
- There are more pages in this discussion • 1 more message in this thread...
You’re viewing a single post only. To view the entire thread just sign in or Join Now (FREE)
Featured News
Add CTP (ASX) to my watchlist
 (20min delay) (20min delay)
|
|||||
|
Last
5.3¢ |
Change
0.002(3.92%) |
Mkt cap ! $39.49M | |||
| Open | High | Low | Value | Volume |
| 5.2¢ | 5.3¢ | 5.2¢ | $6.085K | 117.0K |
Buyers (Bids)
| No. | Vol. | Price($) |
|---|---|---|
| 3 | 559993 | 5.2¢ |
Sellers (Offers)
| Price($) | Vol. | No. |
|---|---|---|
| 5.5¢ | 60757 | 1 |
View Market Depth
| No. | Vol. | Price($) |
|---|---|---|
| 3 | 559993 | 0.052 |
| 2 | 432879 | 0.051 |
| 5 | 407000 | 0.050 |
| 2 | 255000 | 0.049 |
| 2 | 265000 | 0.048 |
| Price($) | Vol. | No. |
|---|---|---|
| 0.055 | 60757 | 1 |
| 0.056 | 112500 | 2 |
| 0.058 | 570046 | 3 |
| 0.059 | 519508 | 2 |
| 0.060 | 90909 | 1 |
| Last trade - 12.00pm 11/10/2024 (20 minute delay) ? |
Featured News
| CTP (ASX) Chart |


