
There are a few occasions with markets when we reach a certain point when the balance can tip either way. We are at such a point at this very moment.
Using the S&P as a guide today. At the end of last week, we saw the market attempting to rally after the painful experience of the previous week. I am going to outline what I think are the two alternatives that I can see the market taking.
Starting first of all with the bullish picture as I have drawn in pencil. This index MUST get above this initial overhead resistance band and start to really do some impressive trading if it is going to be able to continue the bull market. The red line is the Advance/Decline.

Now to look at the bearish picture – again using the S&P, you see I have drawn a very different picture.

I think we will know fairly soon which way the market chooses. Personally. I think the bearish option is more likely. Hopefully, I am wrong.
A fairly similar picture for Australia. Again, I have drawn in the bullish picture – but I think your own imagination can see the bearish option. The only good thing I can see to say about our index is that it is sitting on three years of support but as we know support doesn’t mean much when the atmosphere turns nasty.

And now gold - daily close of the cash market. A triangle. I love triangles. Remember that lovely tight triangle back in January/February which heralded the beginning of the massive rise gold has had this year. This triangle is not as tight and at this stage has not given a clear picture of which direction it wants to take. I think the overall picture is bullish but silver has been causing me a bit of worry over recent days which makes me less confident than I normally would be on such chart pattern. Going to give this a day or two.

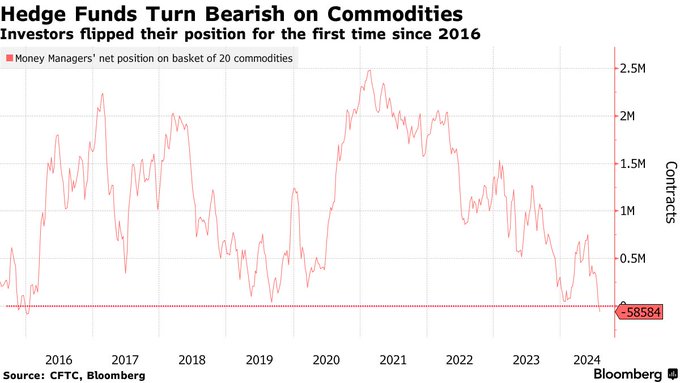
I saw this chart during the week. It shows that funds have lost confidence almost completely in commodities and are now virtually not committed at all. I felt this was actually a bullish sign for commodities even if it takes a bit more time to filter through to the markets.
So at least I could find one encouraging point this week in this period of volatility.
There are a few occasions with markets when we reach a certain...


Add to My Watchlist
What is My Watchlist?
 (20min delay) (20min delay)
|
|||||
|
Last
3,247.6 |
Change
-8.400(0.26%) |
Mkt cap ! n/a | |||
| Open | High | Low |
| 3,256.0 | 3,278.0 | 3,244.8 |
| XSO (ASX) Chart |