Hi all
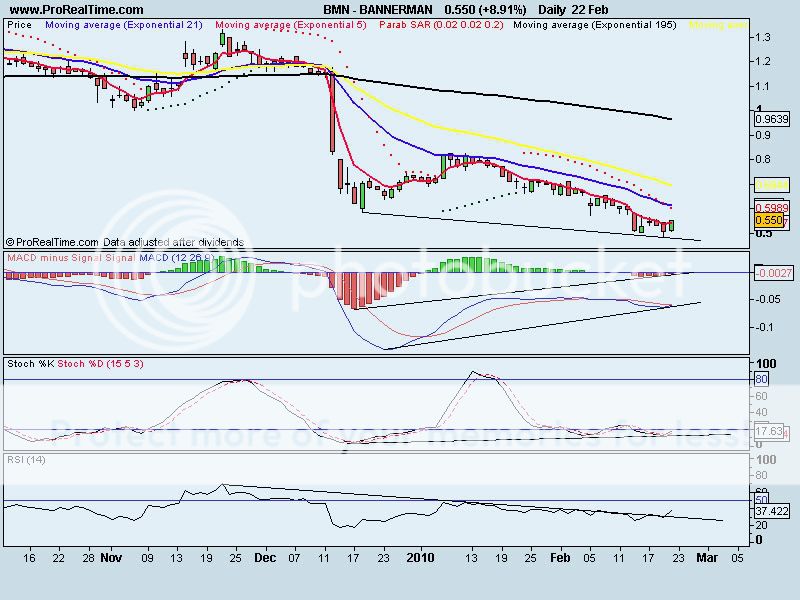
Well I think todays action was very interesting and we saw some good buying pressure coming in after our low last Friday. I think we are very close to the bottom and it could well be in, judging by the divergences on the charts and the breakout today of the downtrend on the RSI. This is a very strong indictator of trend reverals when it breaks its downtrend and even stronger if that downtrend has been diverging from price which as you can see it has. We also have other multiple indicator divergences as well, as I've mentioned before. Chaikin money flow (not shown) has been diverging from price for a while and about to cross into positive territory. The stochastic has bounced off its lower trendline and again shows divergence and the MACD is almost there, probably needs a day or two to confirm its divergence with a cross above the centreline. I think we'll have a good run and see that tomorrow. One other thing to note as well and is that price has closed above the 5 day MA for the first time since 14th January.
Well hope this has inspired a bit more positivity to the thread after all the doom and gloom. I could be totally wrong of course and as always do you're own research but there's some pretty valid points there for a turn in price (about time) to be upon us.
Cheers and good luck to the all.
- Forums
- ASX - By Stock
- BMN
- the case for the bottom (possibly) being in!!
BMN
bannerman energy ltd
Add to My Watchlist
1.16%
 !
$3.50
the case for the bottom (possibly) being in!!
Featured News
Add to My Watchlist
What is My Watchlist?
A personalised tool to help users track selected stocks. Delivering real-time notifications on price updates, announcements, and performance stats on each to help make informed investment decisions.
 (20min delay) (20min delay)
|
|||||
|
Last
$3.50 |
Change
0.040(1.16%) |
Mkt cap ! $718.9M | |||
| Open | High | Low | Value | Volume |
| $3.37 | $3.56 | $3.37 | $14.32M | 4.085M |
Buyers (Bids)
| No. | Vol. | Price($) |
|---|---|---|
| 1 | 500 | $3.49 |
Sellers (Offers)
| Price($) | Vol. | No. |
|---|---|---|
| $3.54 | 1000 | 1 |
View Market Depth
| No. | Vol. | Price($) |
|---|---|---|
| 1 | 500 | 3.490 |
| 1 | 160 | 3.400 |
| 1 | 1474 | 3.370 |
| 1 | 6060 | 3.300 |
| 1 | 481 | 3.290 |
| Price($) | Vol. | No. |
|---|---|---|
| 3.630 | 8771 | 1 |
| 3.640 | 1123 | 3 |
| 3.650 | 3000 | 1 |
| 3.690 | 2800 | 1 |
| 3.740 | 2800 | 1 |
| Last trade - 16.10pm 19/09/2025 (20 minute delay) ? |
Featured News
| BMN (ASX) Chart |


