Hi PK. A nice entry for you gives you a handy retrace leeway
Still, dont give it all back perhaps a trailing 10% stoploss would work..
I like your ultra conservative 200 ema prerequisite but in a predominantly bear market you will just miss to much and the 200 is still falling.
A handy rule of thumb is dont trade a stock below its 30 EMA without an RSI confirming an uptrend and volumes increasing.
EG on the chart the daily 30 period Exponential Moving average is in yellow..back test it on tls and see that it would have been a good Buy/Sell level ( Naturally you would also use other TA oscillators to see if the stock was oversold/bought at the time)..
Naturally the stochastics had the stock in overbought on monday and a retrace or leveling off in an accumulation period allows the stock to step up (or down)..we can basically test the potential direction as a wedge shape forms either rising or falling from its current retrace support level at 325,
The targets you are looking for are the old resistance levels I have white arrowed, Its also nice when they correspond with fibonacci levels..
I read it as now trending long at anywhere around 320..or the last breakout level from the Double Bottom W pattern..
check this site for double bottom projections (355 target)
http://thepatternsite.com/eedb.html
gotta go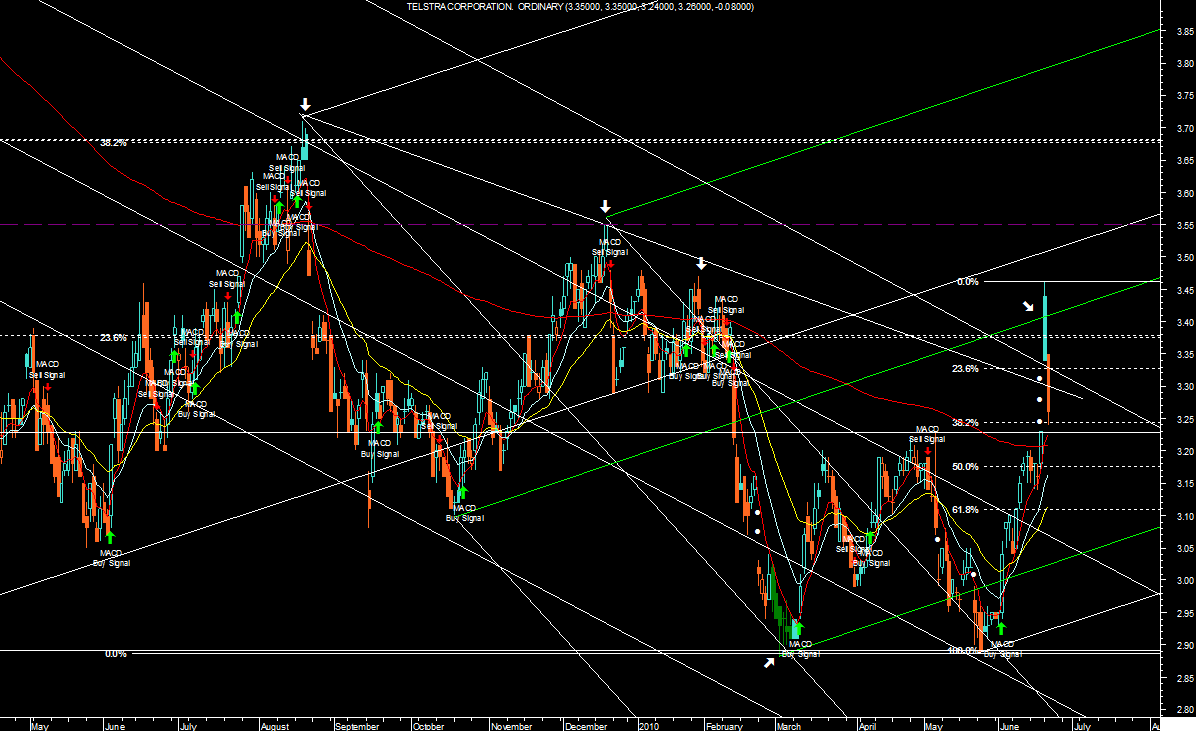
the gap, page-3


Add TLS (ASX) to my watchlist
 (20min delay) (20min delay)
|
|||||
|
Last
$3.85 |
Change
0.010(0.26%) |
Mkt cap ! $44.48B | |||
| Open | High | Low | Value | Volume |
| $3.87 | $3.89 | $3.83 | $65.77M | 17.07M |
Buyers (Bids)
| No. | Vol. | Price($) |
|---|---|---|
| 5 | 64426 | $3.84 |
Sellers (Offers)
| Price($) | Vol. | No. |
|---|---|---|
| $3.86 | 192676 | 8 |
View Market Depth
| Last trade - 16.10pm 26/07/2024 (20 minute delay) ? |
| TLS (ASX) Chart |