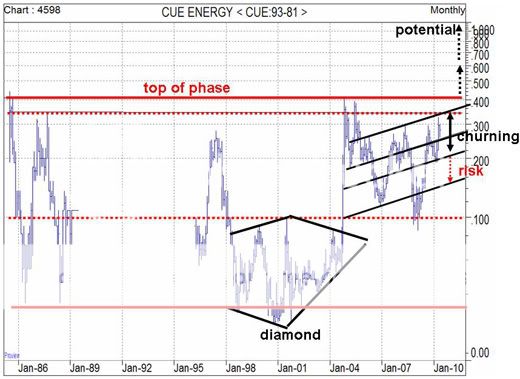
For its entire price history the share price has swung
within a broad range, with lows experienced around 3c and highs between 30c and 40c. Since the late 1990s there have been two significant consolidation phases. Between 1998 and 2004 the stock formed a large diamond base which supported the rise to the top of the range later in 2004. From here the price was deflected, swinging down initially in 2006 to around 11c to experience more volatility in 2008 and 2009 between 8.5c and 30c and then for 2010 so far, between 19c and 32.5c.
The action from 2006 appears as the second major consolidation for the stock, which has not yet reached completion and may incorporate more price swings with support at 24.5c and then lower around 20c. While the phase develops, the stock remains vulnerable to a final swing down towards 14-16c.
On completion of the phase, with a breakaway through 40c the stock, would gain the potential towards 60c and 75c then through $1.00.
Hopefully on Good Artemis Drill results later in Year!!!
Cheers Kimbo
- Forums
- ASX - By Stock
- the life chart of cue
CUE
cue energy resources limited
Add to My Watchlist
0.00%
 !
11.5¢
For its entire price history the share price has swungwithin a...
Featured News
Add to My Watchlist
What is My Watchlist?
A personalised tool to help users track selected stocks. Delivering real-time notifications on price updates, announcements, and performance stats on each to help make informed investment decisions.
 (20min delay) (20min delay)
|
|||||
|
Last
11.5¢ |
Change
0.000(0.00%) |
Mkt cap ! $80.47M | |||
| Open | High | Low | Value | Volume |
| 11.5¢ | 11.5¢ | 11.0¢ | $4.144K | 36.53K |
Buyers (Bids)
| No. | Vol. | Price($) |
|---|---|---|
| 11 | 555775 | 11.0¢ |
Sellers (Offers)
| Price($) | Vol. | No. |
|---|---|---|
| 11.5¢ | 109294 | 3 |
View Market Depth
| No. | Vol. | Price($) |
|---|---|---|
| 11 | 555775 | 0.110 |
| 5 | 1400000 | 0.105 |
| 10 | 1070547 | 0.100 |
| 2 | 51050 | 0.095 |
| 2 | 160988 | 0.090 |
| Price($) | Vol. | No. |
|---|---|---|
| 0.115 | 109294 | 3 |
| 0.120 | 515504 | 8 |
| 0.125 | 195836 | 7 |
| 0.130 | 386252 | 2 |
| 0.135 | 300000 | 1 |
| Last trade - 16.10pm 18/09/2025 (20 minute delay) ? |
Featured News
| CUE (ASX) Chart |


