Good evening/ morning all,
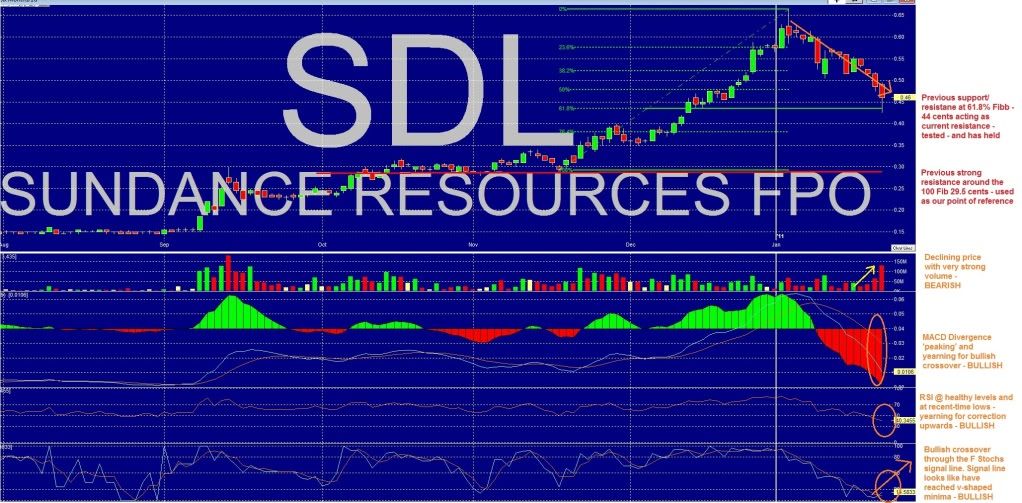
Here are some of my thoughts when looking through the latest SDL chart and indicators:
Volume - Sustained increase in volume to complement sharp falls in share price indicate a bearish trend, but once this is shone in light of other indicators that appear to at an apex and heading in the other direction today's volume - on volume not seen since the Christmas rally - suggest that the worst may have past. In a isolated technical sense this is a bearish signal, but once shone in light of the trend in other indicators and lack of adverse news, this indicates the bottom of the trough and signals the ushering of a new potential uptrend - BULLISH.
MACD - MACD divergence is at a level not seen in recent time, this indicates a short-term 'shock'. Share price will need to appreciate sharply before a bullish crossover will be seen IMO and in such circumstances, my weight on this indicator as a leading indicator is impaired. IMO divergence is too great and circumstances changed too much to make this a useful indicator IMO. However, a change in direction of the short-term line over the next few days will determine direction.
RSI - Very healthy levels, especially from the cooked levels we have seen in December. A very good sign indicating there is plenty in the tank and stock is strongly leveraged to a powerful uptrend once the bulls kick back in action or de-risking announcement made.
Fast Stochastics - Signal line appears to have bottomed out with a V-apex minimum and a BULLISH crossover between the short term line and signal line made mid-day. Used as a leading indicator, this suggests a very BULLISH signal.
Also, there is the budding signs of a very strong positive divergence between Fast Stochs and share price (the 2 orange arrows pointing towards eachother) - this is a BULLISH signal.
Candles - Bearish 'Hangman' candle appeared to have set off the bears confirmed by the past 2 trading days creating a near Three-Black-Crows formation. TBC is a relatively strong bearish signal and suggests that we may need to see several days of trading before we will see a Bullish reversal candle confirming we are at the bottom. This is the only really bearish signal I can see from my set of indicators. BEARISH.
Tea leaves/ Crystal ball/ Star-gazing - leading up to Australia day we may see sustained selling and testing of the 61.8 Fibb (green line) and at worst a light kissing of the 76 Fibb (between the green and red drawn lines). IMO touching the 100% Fibb would require heavy fund selling - and that would only happen on either potential inside knowledge of adverse events or disclosed bad news - HIGHLY UNLIKELY IMO.
Best guess, we may see one more bout of the nervous-nellies bailing before the bargain hunters and FOMOs (Fear of Missing Out) crew come back into play. I would be looking for a 'cup-and-handle' or 'double-top' formation over the next few weeks as nervous-nellies take any uptrend as an excuse to bail.
IMO we have reached the bottom and blue skies (or Hyundai i40) will be seen shortly :)
Foxtrot
Add to My Watchlist
What is My Watchlist?


