GOLD BULL ALERT: What To Expect Next For Gold After Yesterday’s Plunge Ended One Of Gold’s Longest Streaks In 4 Decades
KWN..
This is a very important alert on what to expect next for the price of gold after yesterday’s plunge ended one of gold’s longest streaks in 4 decades.
Gold Streak
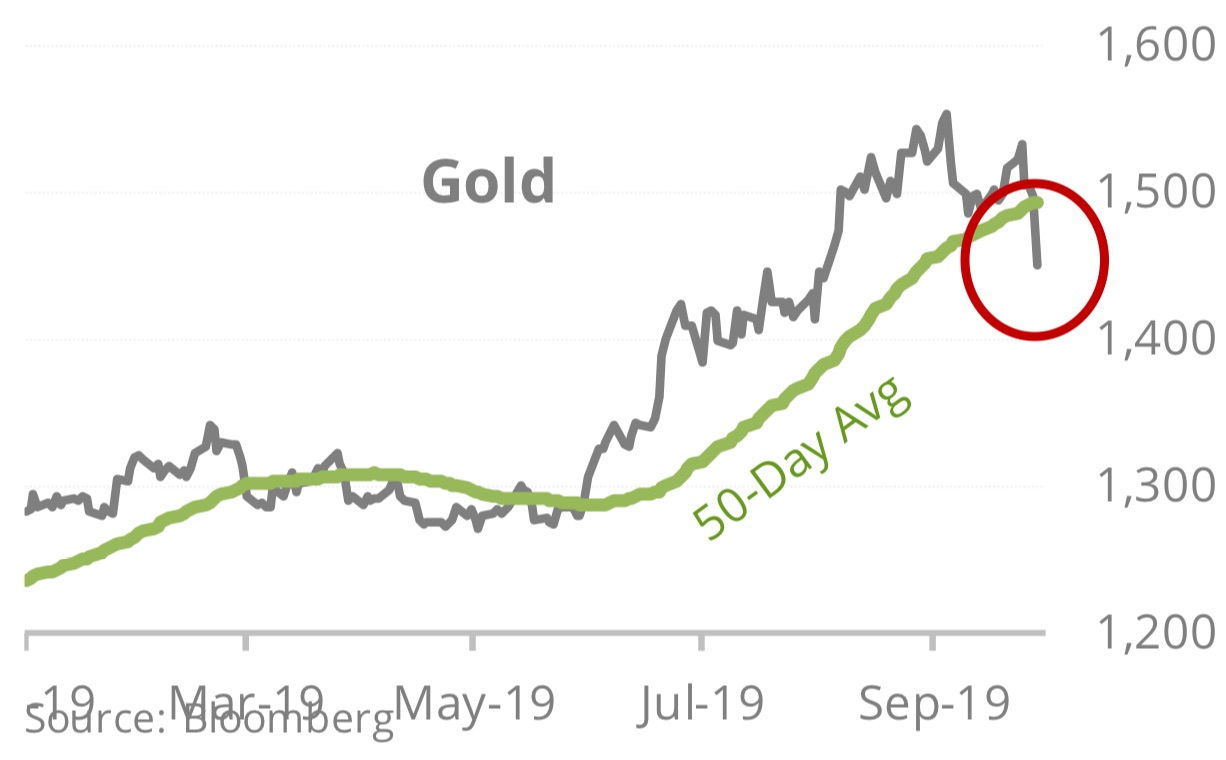
October 1 (King World News) – Jason Goepfert at SentimenTrader: “For the first time in more than four months, gold fell below its 50-day moving average, ending its 8th-longest streak above that average. It also comes relatively soon after gold had reached a 52- week high. Similar action led to further short-term selling, but long- term gains.Gold hasn’t been able to catch much of a break. Risk has been building for a while, then the market broke early in September. That kind of behavior has a tendency to lead to even more selling pressure, and so far it’s been following through.
Now the metal has busted below its 50-day average for the first time in more than four months. (See chart below).
Rarely Seen
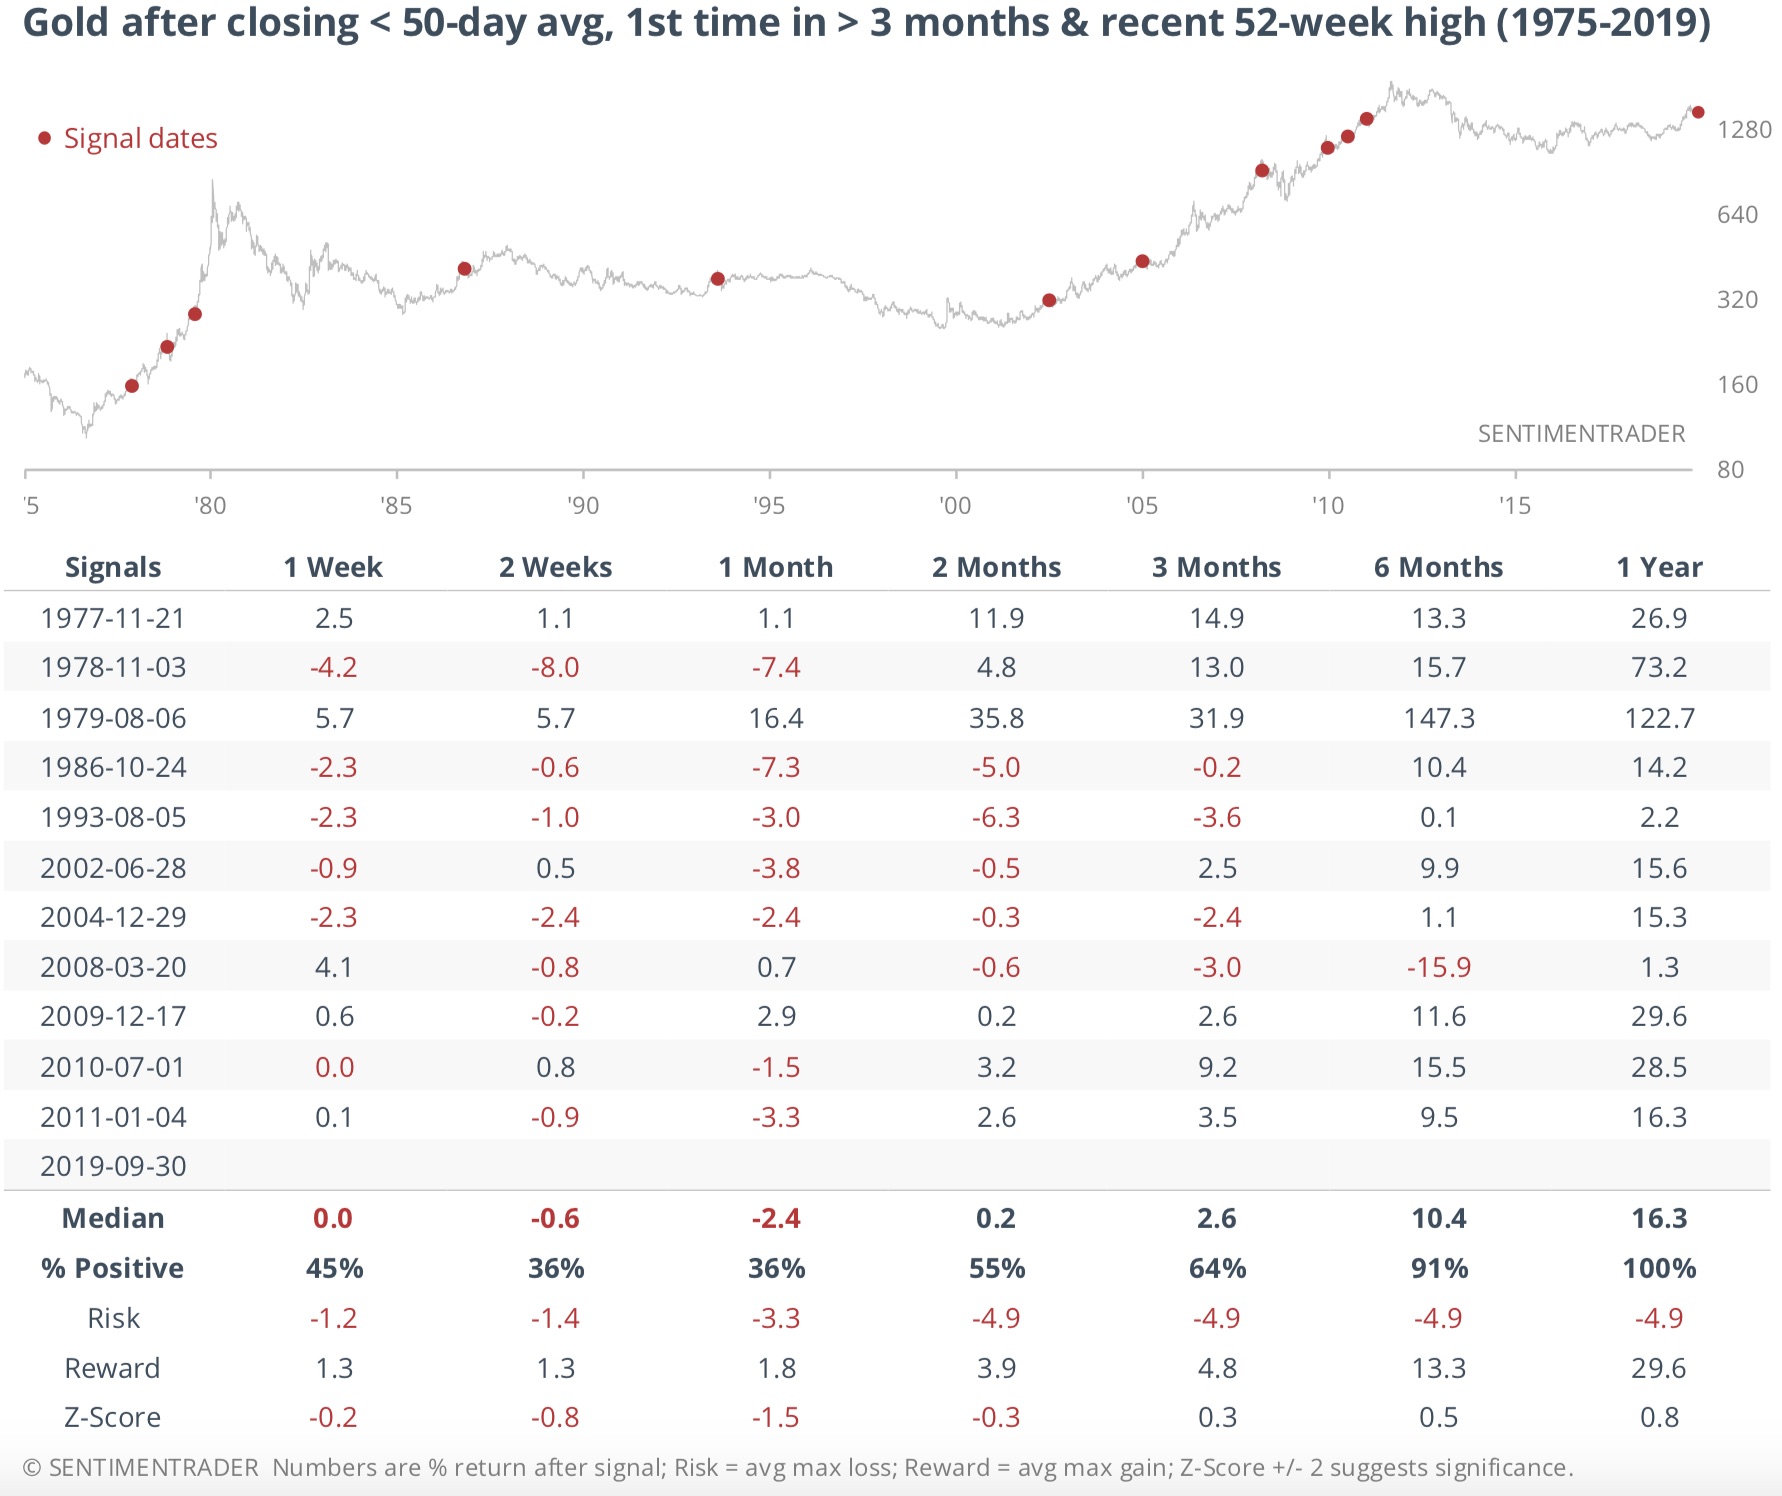
Over the past 45 years, it’s been rare to see gold go this long above its moving average, even during the big momentum runs in the late 1970s and early 2000s…Below, we can see that the end of the current streak at 87 days above its 50-day average ranks among the longest in over four decades.
The End Of A Historic Run
This Trading Action Only Happens During Long-Term Bull Markets
Displays of extreme momentum, however, often signify some fundamental or structural change in a market. When buyers were interested enough in gold to sustain it above its moving average for months at a time, it occurred almost exclusively during long-term bull markets. So, returns over the next 6-12 months were impressive. (See chart and table below).Gold’s 6-12 Month Returns (After The End Of Historic Runs) Have Been Extremely Impressive Averaging Nearly 30% Gains For Gold 12 Months Later!
Looks like excellent Risk to Reward to me???
GOLD BULL ALERT: What To Expect Next For Gold After Yesterday’s...


Add to My Watchlist
What is My Watchlist?
