First up this post is huge... I got carried away looking at greater timespans (I blame you LightHouuse for yer eddies comment LOL)
Anyways, it's a bit of a ramble cos i attack a few things I see n go into a bit about fibbs n elliot waves n wave theory versus momentum and patterns...
Tradeable stuff is way down the bottom.
=================== Last week's analysis on this pair went so well that I am going to continue the narrative.
First up Larger timespans...
Grandaddy of em all ... Quarterly...
This is like...17 YEARS of data...
over the last 17 years, we appear to have traced out 3 waves...
the marked waves 1 and 3 appear impulsive,, IE expanding in the upwards direction. Current price action is DEFINATELY in a counter trend move if the waves 1 to 3 are regarded as the trend.
Current Price action appears corrective. Ovelapping Highs and lows, Corrective counter trend trading in a large enough range can give LOTS of trading opportunities... On this time span Volatility on a large scale can translate to sweet repetitive setups on lower timescales...
Plenty of room for downside still here, with My favourite retrace level between 61.8% and 50 % untested.
BUT this is current countertrend action, resumption to upside could occur Pretty much at any time now ON THIS TIMESPAN, as a definate three wave counter trend structure has occurred recently, and price is dithering around the mid point of this structure... If price can rise above here, the potential of this being a strong retrace to higher highs MAY start from roundabout where price is now.
Of Course that there Greater 17 year structure COULD in itself be a three wave to be corrected and the opposite scenario has to include Price making a low lower than those displayed on this chart.
I am choosing to ignore this latter scenario for the moment, But am no means convinced that local downside this chart is fully done...
Next up, the weekly Chart:
Just for interest's sake, I have highlighted the range of last week's bar that I actively traded... on this scale it seems hardly anything :)
On this scale without a doubt we have some volatility, Overlapping High's and lows though so corrective is still the word.
Note Divergence on the last two lows between Price and the MACD moving averages, The machd is currently ABOVE the zero line... meaning uptrend, likewise the Stochastic is above 50%... bot of these signals on this time span are currently a bit unconvincing. IE very close to flat/turning down.
Note also the wicks on the last three weekly candles suggesting some strong selling pressure at these levels.
Wave counts DO seem to support a potential 5 wave unfolding with a higher five wave still possible. the most simplistic target if we are is shown by the two vertical blue line segments, t, a simple same length of the combined length of waves 1 to 3 to give a target length of wave 5, around the 1.526 area.
The bounce at the conjectured 4??? occurred at a strong zone of support.
Ultimately though, price is fairly balanced here and can be seen to potentially be in a trap, as bounded by the grey trendlines.
The Range marked out by the two horizontal lines has large historical significance 30 years back with 1980 highs, 1993 highs and more recent points of resistance. I'd suggest this could be an intenslely contested area.
Zooming in a bit and looking at the Daily..
Mkay... Here we have an interesting historical phenomenon of a pattern which I started noticing a couple of months back and am still to do the research to trade on it. Here's the original post I did on it In a nutshell, an elongated S pattern, Generally retraces, though may need this rule modified to generally retraces to AT LEAST 50%
Moving along I can easily convince myself that this current uptrend is unfolding as a 5 wave pattern to the upside, currently in wave 5, about halfway. I've marked out the MACD with what I beleive is a rendition of momentum counts that identify waves in an elliot wave sequence...
I BELEIVE that we are still in the greater weekly up trend marked by the larger purple numbers... and the most simplistic target if we are is shown on the zoomed in weekly chart, a simple same length of the combined length of waves 1 to 3.
But If one just wants to consider price action from point 3 (purle), the last major high on this chart, then current price action could be forming a new lower High
AND the true reality of current price action (IE the last two weeks) leaves us with a lower price than two weeks ago, and a first discernable lower high since the low at 4??? was put in and a lower low (just) after thatwhich price is now above. Sooo until otherwise (a higher high) on this timespan, then downside can remain on the cards..
Again looking at very last localised action, the peak prior to the marked small black wave 3, and the peak traced out by price in the last two bars Does look like a topping pattern, and three sets of marked areas of resistance beckon.. These three are:
The black line, based on price action, highlights a specific earlier level of resistance that may now take on the role of support.
The 50 % retrace level of the current up trend
The 61.8% retrace level of the current up trend.
Zooming down to the 4 Hrly to see what that is all about:
First up, I finished last week's post with the following:
So in summation, I beleive that there is a high potential that price MAY go to further downside before the next week is out and for this week I will initially be concentrating on looking for ways to capture conjectured downside.. I would like to see a lower high before taking a strong short on the 4 hrly or hourly, and I will be watching both for initial downside OR Upside to give me clues as to the strength of marked support and resistance.
And this chart from the 4 hrly with conjectured price moves:
Now I have gone n screwed up and neglected to save the chart after drawing all those arrows last Sunday. The rest of the charts in this post have been redrawn post price movement so if it appears I am "curve fitting" post the effact, darn tootin I am, and if this works out all nicely analysis wise I Will point out post the fact that I might know my shizzle. If I get it wrong, the subject will never be mentioned again... and we shall all move on... lol!
Alright
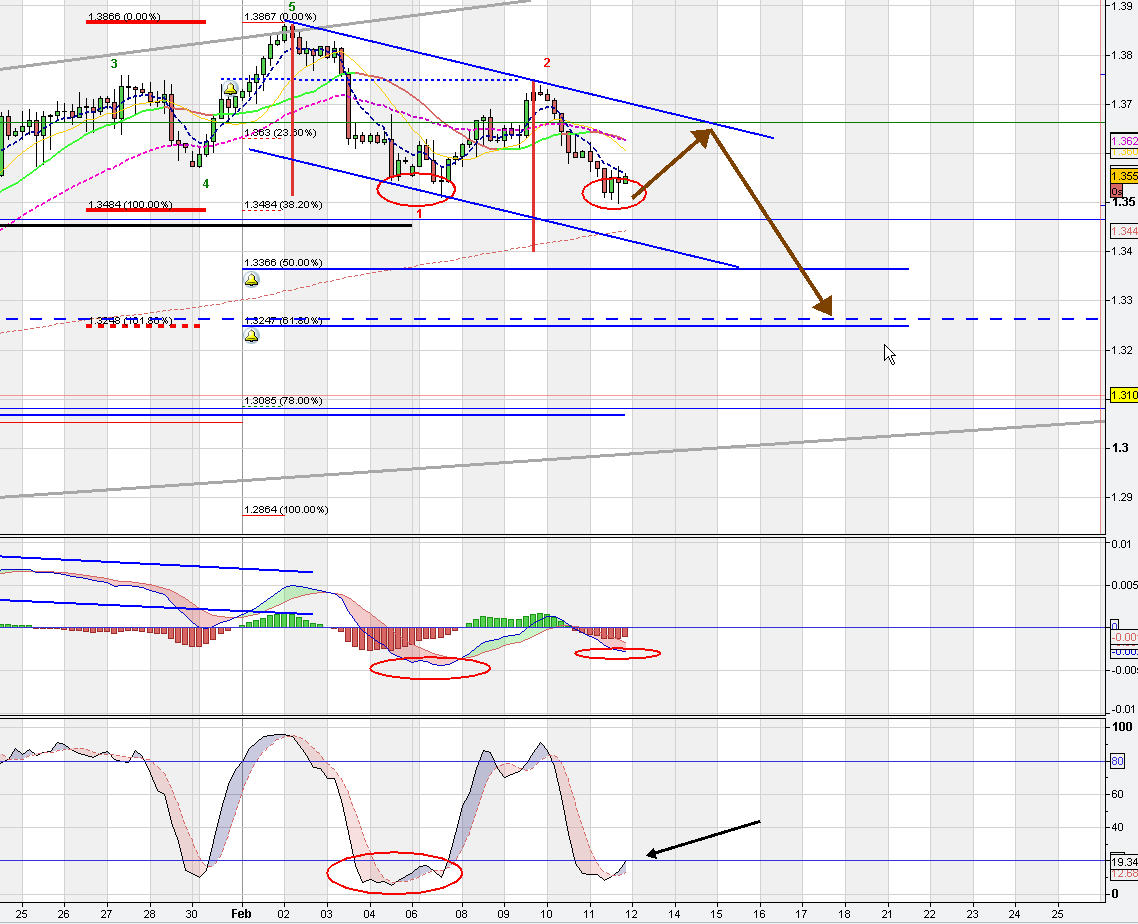
Current 4Hr Chart:
M'kay...first up, give or take a wee bit of fiddling the conjectured Brown arrowed price movement from last week's analysis has at least partly played out, pretty much reaching the level up projected, and falling from there.
I reckon this kinda narrows down the possibilities for next weeks price action, n I pretty much see three possibilities able to unfold...
Possibility 1:
This scenario is based on a three wave completion, at a level coincident with Equal measure move from highest high to first low compared to latest high.
Potential channel bottom based on channel marked taken from two latest highs and copied to concide with the first low
"close to" 50% percent retrace of previous wave up
Previous strong resistance as marked by Black line (as per daily chart)
Projected target of the larger arrow is based on observation that three wave sequences counter trending to a major trend have a high probability at least totally rretracing.
Upside POTENTIAL is beng hinted already by the location of the stochastics and the MACD moving averages.
Possibility 2:
THis scenario is based on the conjecture that we are starting a 5 wave sequence down on this timespan, currently in the third leg down.
The target for wave three (represented by large brown arrow) is at a level where there is a confluence of targets and support.
Downside target calculated as 1.618 fibbonacci extension of first downleg (wave 1)... This target is also "legitimised" by theory on fibbbonacci extensions, where a target after a 61.8 percent retrace (as occurred with the previous high to current price) gives a downside target extension of 1.618. The dashed blue line is a level I marked on the weekly showing the BOTTOM of a historical range of congestion.
Possibility 3:
In this scenario I am looking at the possibility of price action performing a little similar to how it did at the start of last week that is initially heading to the upside before later weakness occurring in the last half of the week.
This scenario also takes into account similar releative positions of the 4 hourly stochastic and the MACD moving averages as well as the divergence showing on the macd.
Sooo in summation for this week I am more inclined to beleive that in the early part of the week we may see more downside, But some strong potential resistance is coming in to play.
I am dead keen to see how price reacts to the conjectured downsloping channel, possibly a bull flag, and I will attempt to look for long opportunities if price inteesects this channel. I will be entering this next week positionless and trying to play it as it unfolds, with orientation towards upside later in the week watching resistance levels as marked for targets for shorts or opportunities for longs.
Wave counts DO seem to support a potential 5 wave unfolding with a higher five wave still possible.
M'kay...first up, give or take a wee bit of fiddling the conjectured Brown arrowed price movement from last week's analysis has at least partly played out, pretty much reaching the level up projected, and falling from there.


