hi just some charts after close this morning in america.
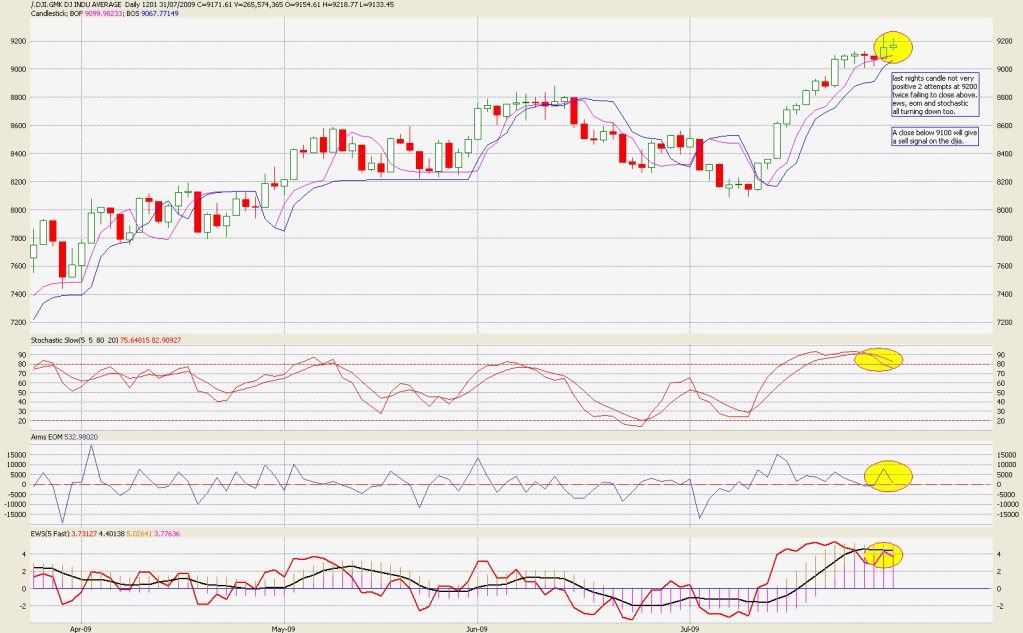
The djia daily chart shows its had 2 attempts above 9200 both times closed below 9200, last nights high was lower then the night before but no lower low was made.
The ews indicator was turning up but when got to the black line turned back down so the ews indicator is still a sell but waiting for confirmation by the price going below the bof which is current at 9099. The eom indicator is turning down almost crossing the 0 line, stochastic is starting to drop and crossed back below the 80 mark.
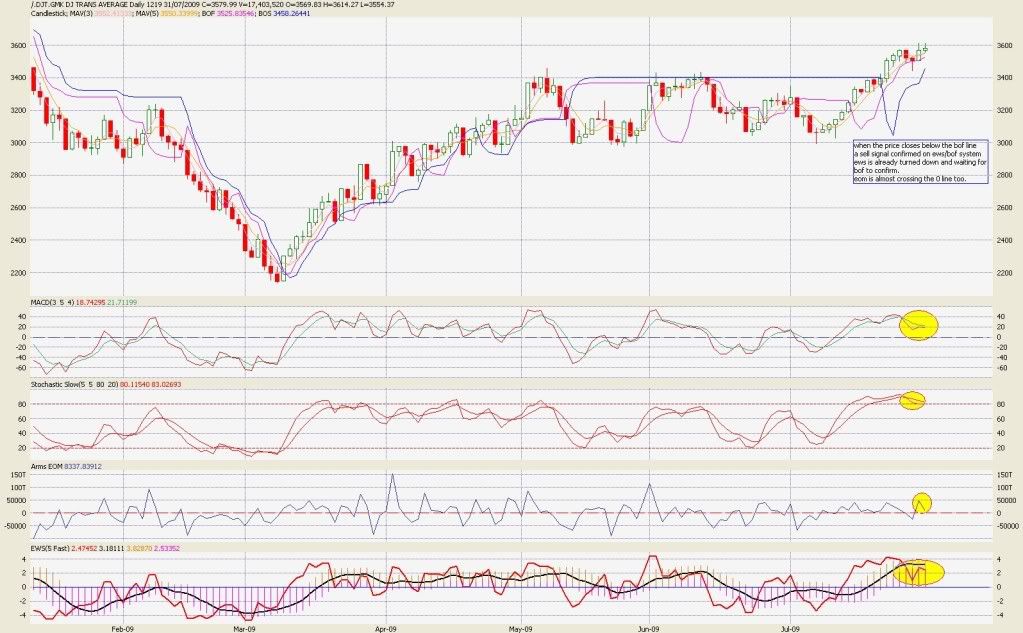
djia transports, the ews moved up and now turned back down before crossing just waiting for the bof to cross at 3525. eom is moving down too.
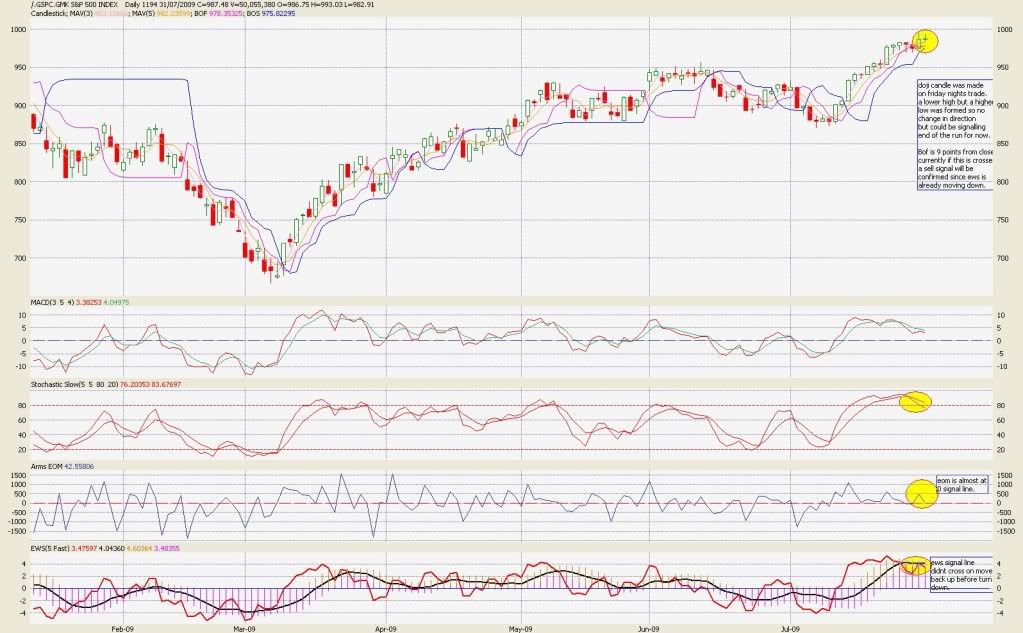
sp500 the ews did the same as the other charts moved up but turned down on friday before crossing the signal line, waiting for the bof to cross which is 9 points away on this chart, eom is almost at 0 too. stochastic also crossed below the 80 mark too.
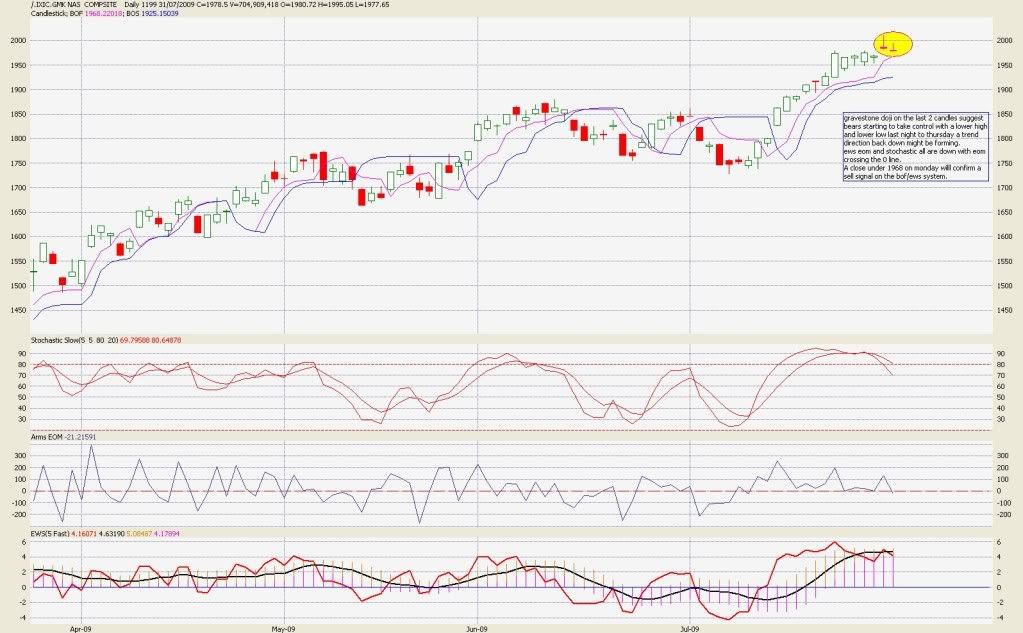
The nasdaq chart which been mentioned has been leading this rally currently looks the weakest of the 4 charts. The eom has crossed the 0 line where the other charts its almost crossing but hasnt got there yet. The stochastic is below the 80 mark and the ews has turned down, the bof needs 10 points down before a sell signal is given on the bof ews system. Also the last 2 candles have both been closing below open prices, last 2 days have made gravestone doji candles which suggests a turning point for the rally short term. A lower low and a lower high was created on friday from thursdays trading too, which hasnt been seen yet on any other index charts.
- Forums
- ASX - By Stock
- thoughts.
hi just some charts after close this morning in america. The...
-
-
- There are more pages in this discussion • 43 more messages in this thread...
You’re viewing a single post only. To view the entire thread just sign in or Join Now (FREE)
Featured News
Add XJO (ASX) to my watchlist
 (20min delay) (20min delay)
|
|||||
|
Last
8,103.2 |
Change
-6.700(0.08%) |
Mkt cap ! n/a | |||
| Open | High | Low |
| 8,109.9 | 8,110.2 | 8,073.7 |
Featured News
| XJO (ASX) Chart |


