Index options that is.
Charts are clear as mud to my tired eyes...
SPX as expected hit 1100, the 50% fib.
But the stochastic and MACD suggest there's further to go....the 50 day sma, the 61.8% fib at 1110? Or is this it?
Ditto for the DJIA ($INDU chart)
US dollar index made a strong comeback, and to me it looks like a rectangular pattern before a break to the upside (continuing the trend). That should put a ceiling on prices for now. However, its indicators still say a fall.
On many charts, stochastics and MACD's have just crossed up...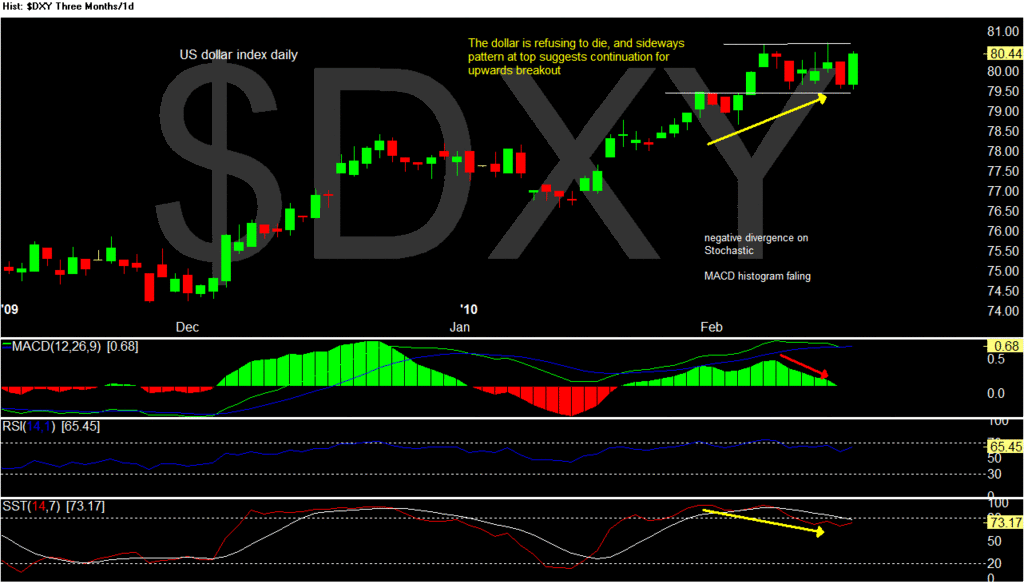
thursday options


Add XJO (ASX) to my watchlist
 (20min delay) (20min delay)
|
|||||
|
Last
8,091.9 |
Change
46.800(0.58%) |
Mkt cap ! n/a | |||
| Open | High | Low |
| 8,045.1 | 8,091.9 | 8,045.1 |
| XJO (ASX) Chart |