for a little while I have been following the similarities of this correction to that of 2006....note how even the 2006 correction sits nicely in between the 161.8% and 261.8% fib extension lines of this correction. The 2006 correction was a double bottom affair with bottoms a month apart. The peak in between the bottoms exceeded the 50% of the first drop but failed to reach 61.8% retrace....we are now nearly at that point in this correction. IF (and I say IF) the similarity continues then there should be one more good buying op coming up in the next 2 weeks before the next leg up.....
And all this would fit nicely into Terry Laundrys T theory. He likes his Ts to have double bottoms and he remains confident that there could be still a huge upside left in this market as he believes there is still much more money to come in before a final peak in August.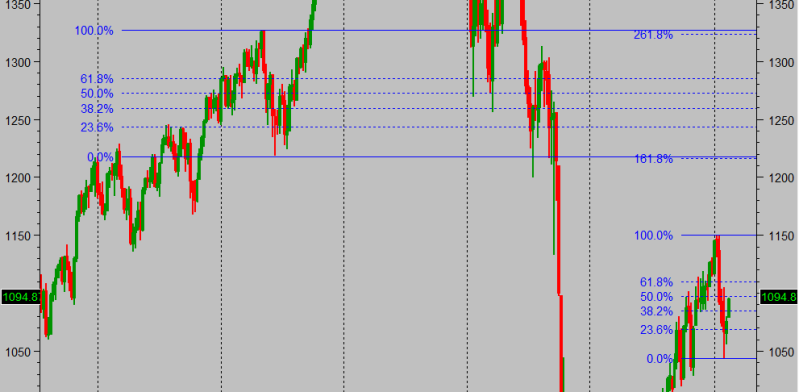
for a little while I have been following the similarities of...


Add XJO (ASX) to my watchlist
 (20min delay) (20min delay)
|
|||||
|
Last
7,921.3 |
Change
60.100(0.76%) |
Mkt cap ! n/a | |||
| Open | High | Low |
| 7,861.2 | 7,938.3 | 7,861.2 |
| XJO (ASX) Chart |