Far be it for me to stick my head in the lions mouth but I put this zinc chart up the other day on the RXL thread (little zinc speccie)....This may be one good use for the Andrews fork. This chart may be suggesting to us that the fall in zinc prices this year (or base metal prices generally) has been a shorter term correction in a longer term uptrend and that the correction could have ended 6 weeks ago......I know this bullish outlook is a departure from my more usual "black, black my world is black" theme but hey, it can't be ignored. There is a similar fork on the copper chart but the fork is better seen in zinc.
This could be a good sign for our markets. Dunno what it means for the US though.....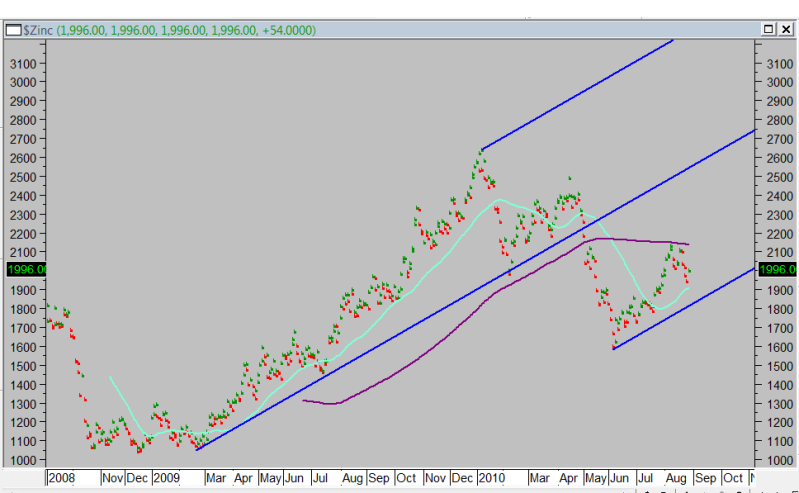
thursday rock and roll


Add XJO (ASX) to my watchlist
 (20min delay) (20min delay)
|
|||||
|
Last
7,767.5 |
Change
7.900(0.10%) |
Mkt cap ! n/a | |||
| Open | High | Low |
| 7,759.6 | 7,819.0 | 7,754.9 |
| XJO (ASX) Chart |