Ohh and this is the Blog post from yesterday...
=====
For a wee while I have been closely monitoring the SPI looking for a couple of esoteric Winkinatcha things to see whether this current weakness has legs or is a "minor" correcteion.
'Twould appear now that this week is going to be the clincher, signal wise.
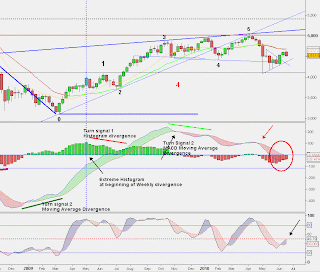
Here is the Weekly chart::
What I am looking for here is highlighted by the ellipse on the histograms/moving averages of the MACD.
This is the esoteric Winkinatcha "bracketed bar" tell... that is ... moving averages are on either end of a particular histogram bar.. the following bar if of lesser magnitude suggests trend direction... of greater magnitude suggests trend continuation.
Waiting for that following bar to form (this week)
We ARE NOT there yet, despite my personal thoughts that we soon will be....
Whilst on this chart two things I would like to note,
Though barely discernible, tprice halted its rrise at the 13 MA (thin orange) , The signal line on the stochastics is butting up against the 50% line.
Both suggesting that the price level reached at 4630 odd is strong resistance indeed.
Running out of time at the moment, however just as a side note, the daily gave a trend change signal (as per histogram bar bracket) yesterday, suggesting down was to occur.
Further charts later.
;)
Add to My Watchlist
What is My Watchlist?


